Most traders finish a losing trade and move on. They tell themselves it was bad luck, a bad market, a bad day. Then the same trade happens again. Same setup, same decision, same result.
The problem isn't the trade. It's that no one ever properly examined it.
A trade analyzer exists to do exactly that — break down what happened, why it happened, and what the data says about how often it's happening. Not as a punishment, but as a diagnostic. The traders who improve consistently aren't the ones with better instincts. They're the ones who know what to look at after the trade closes.
This guide covers what a trade analyzer actually does, which metrics matter, what most traders get wrong when reviewing their trades, and how to build a review process that compounds over time.
What a Trade Analyzer Actually Does
A trade analyzer is a tool — or a process — that takes the raw data from a completed trade and turns it into something usable. That means going beyond whether the trade was a win or a loss, and looking at the decisions that shaped the outcome.
Done well, it answers questions like:
Did the trade follow the original plan, or did you deviate mid-trade?
How far did price move in your favour before you exited?
How far did it move against you before it recovered?
Was the exit driven by the chart, or by emotion?
Does this outcome fit a pattern you've seen before?
A basic trade review process asks some of these questions manually. A proper trade analyzer — especially one built into a trading journal software — captures the data automatically and surfaces the patterns across dozens or hundreds of trades, not just the one you're looking at today.
The difference matters. A single bad trade tells you almost nothing. Fifty bad trades with the same shape tells you everything.
The Metrics That Actually Tell You Something
Win rate is the metric most traders fixate on. It's also one of the least useful in isolation.
A trade analyzer worth using goes deeper. Here are the metrics that move the needle:
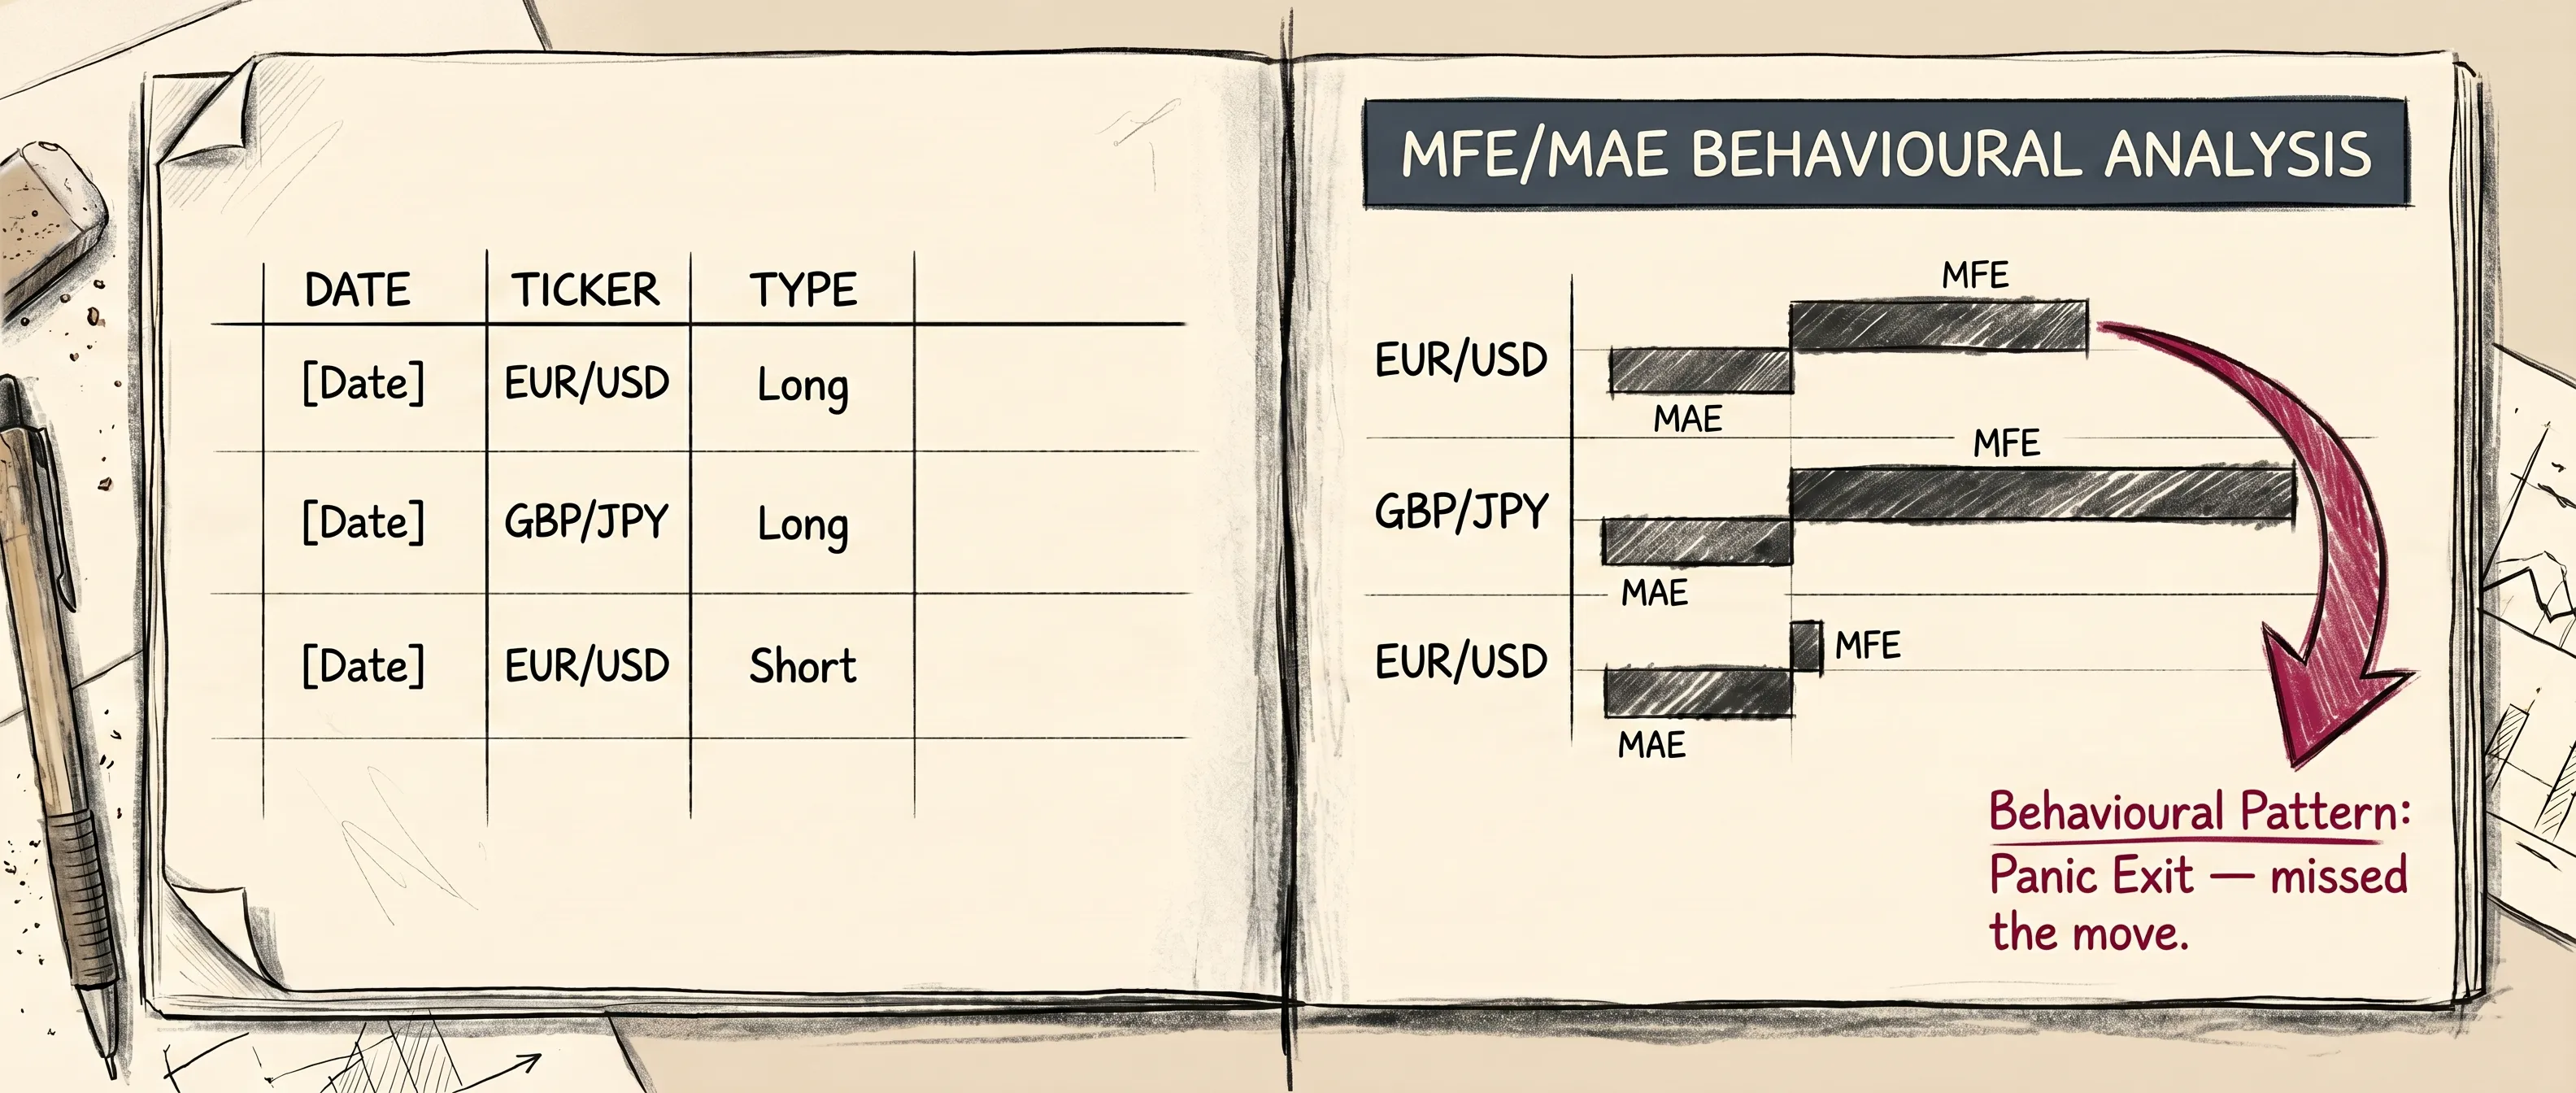
Maximum Favourable Excursion (MFE) MFE measures how far a trade moved in your favour before you exited. If your EURUSD long moved 30 pips in the right direction and you closed it at 10 pips, your MFE was 30. That gap — between what was available and what you captured — is where most traders quietly bleed edge without realising it.
Maximum Adverse Excursion (MAE) MAE shows how far price moved against you before recovering. If your trade hit -15 pips before coming back and closing green, your MAE was 15. This tells you whether your stop placement is appropriate or whether you're regularly surviving drawdowns you shouldn't be exposed to.
Entry and Exit Efficiency Efficiency scores compare where you entered and exited relative to the range of the candle or session. A trader who consistently enters at the top of a range and exits before the move completes has a measurable efficiency problem — and that number shows up clearly in a trade analyzer.
R-Multiple Rather than raw points or pips, R-multiple expresses every outcome as a multiple of the risk taken. A trade that risked 20 pips and made 40 is +2R. This normalises outcomes across different pairs, instruments, and position sizes — making your data comparable in a way raw figures can't be. A flat or negative average R is a warning sign regardless of what your win rate says.
End Trade Drawdown (ETD) ETD captures the gap between your MFE and what you actually closed with — in other words, the profit that was available but not taken. If a GBPJPY trade reached an MFE of 3R but you closed at 1R, the ETD is 2R. Across many trades, a consistently high ETD points to an exit timing problem, not a setup problem. It's one of the most specific diagnostics a trade analyzer can surface, and one of the most commonly overlooked.
Behavioural Tags The best trade analysis includes qualitative flags — early exit, revenge entry, held past stop, oversized position. These tags turn into searchable, filterable patterns over time. Without them, behavioral trading analysis stays theoretical. With them, you can see exactly how many trades last month were driven by tilt rather than setup.
What Most Traders Get Wrong When Reviewing Trades
The most common mistake is reviewing trades in isolation. Looking at one GBPJPY loss and asking "what went wrong here?" is useful for about five minutes. The real answer isn't in that trade — it's in whether the same shape appears in trade 12, trade 28, and trade 41.
Trade analysis only becomes powerful when it's aggregated. That's why trading consistency and pattern recognition are inseparable — you can't build consistency if you're not tracking what you actually do under pressure, across sessions, across instruments, across weeks.
The second mistake is reviewing too late. Waiting until the end of the week — or the end of the month — to look at trades means the context is gone. What were the market conditions at that entry? Were you on a losing streak when you sized up? Did you exit early because of news, or because of anxiety? A review done 72 hours after the fact is mostly guesswork.
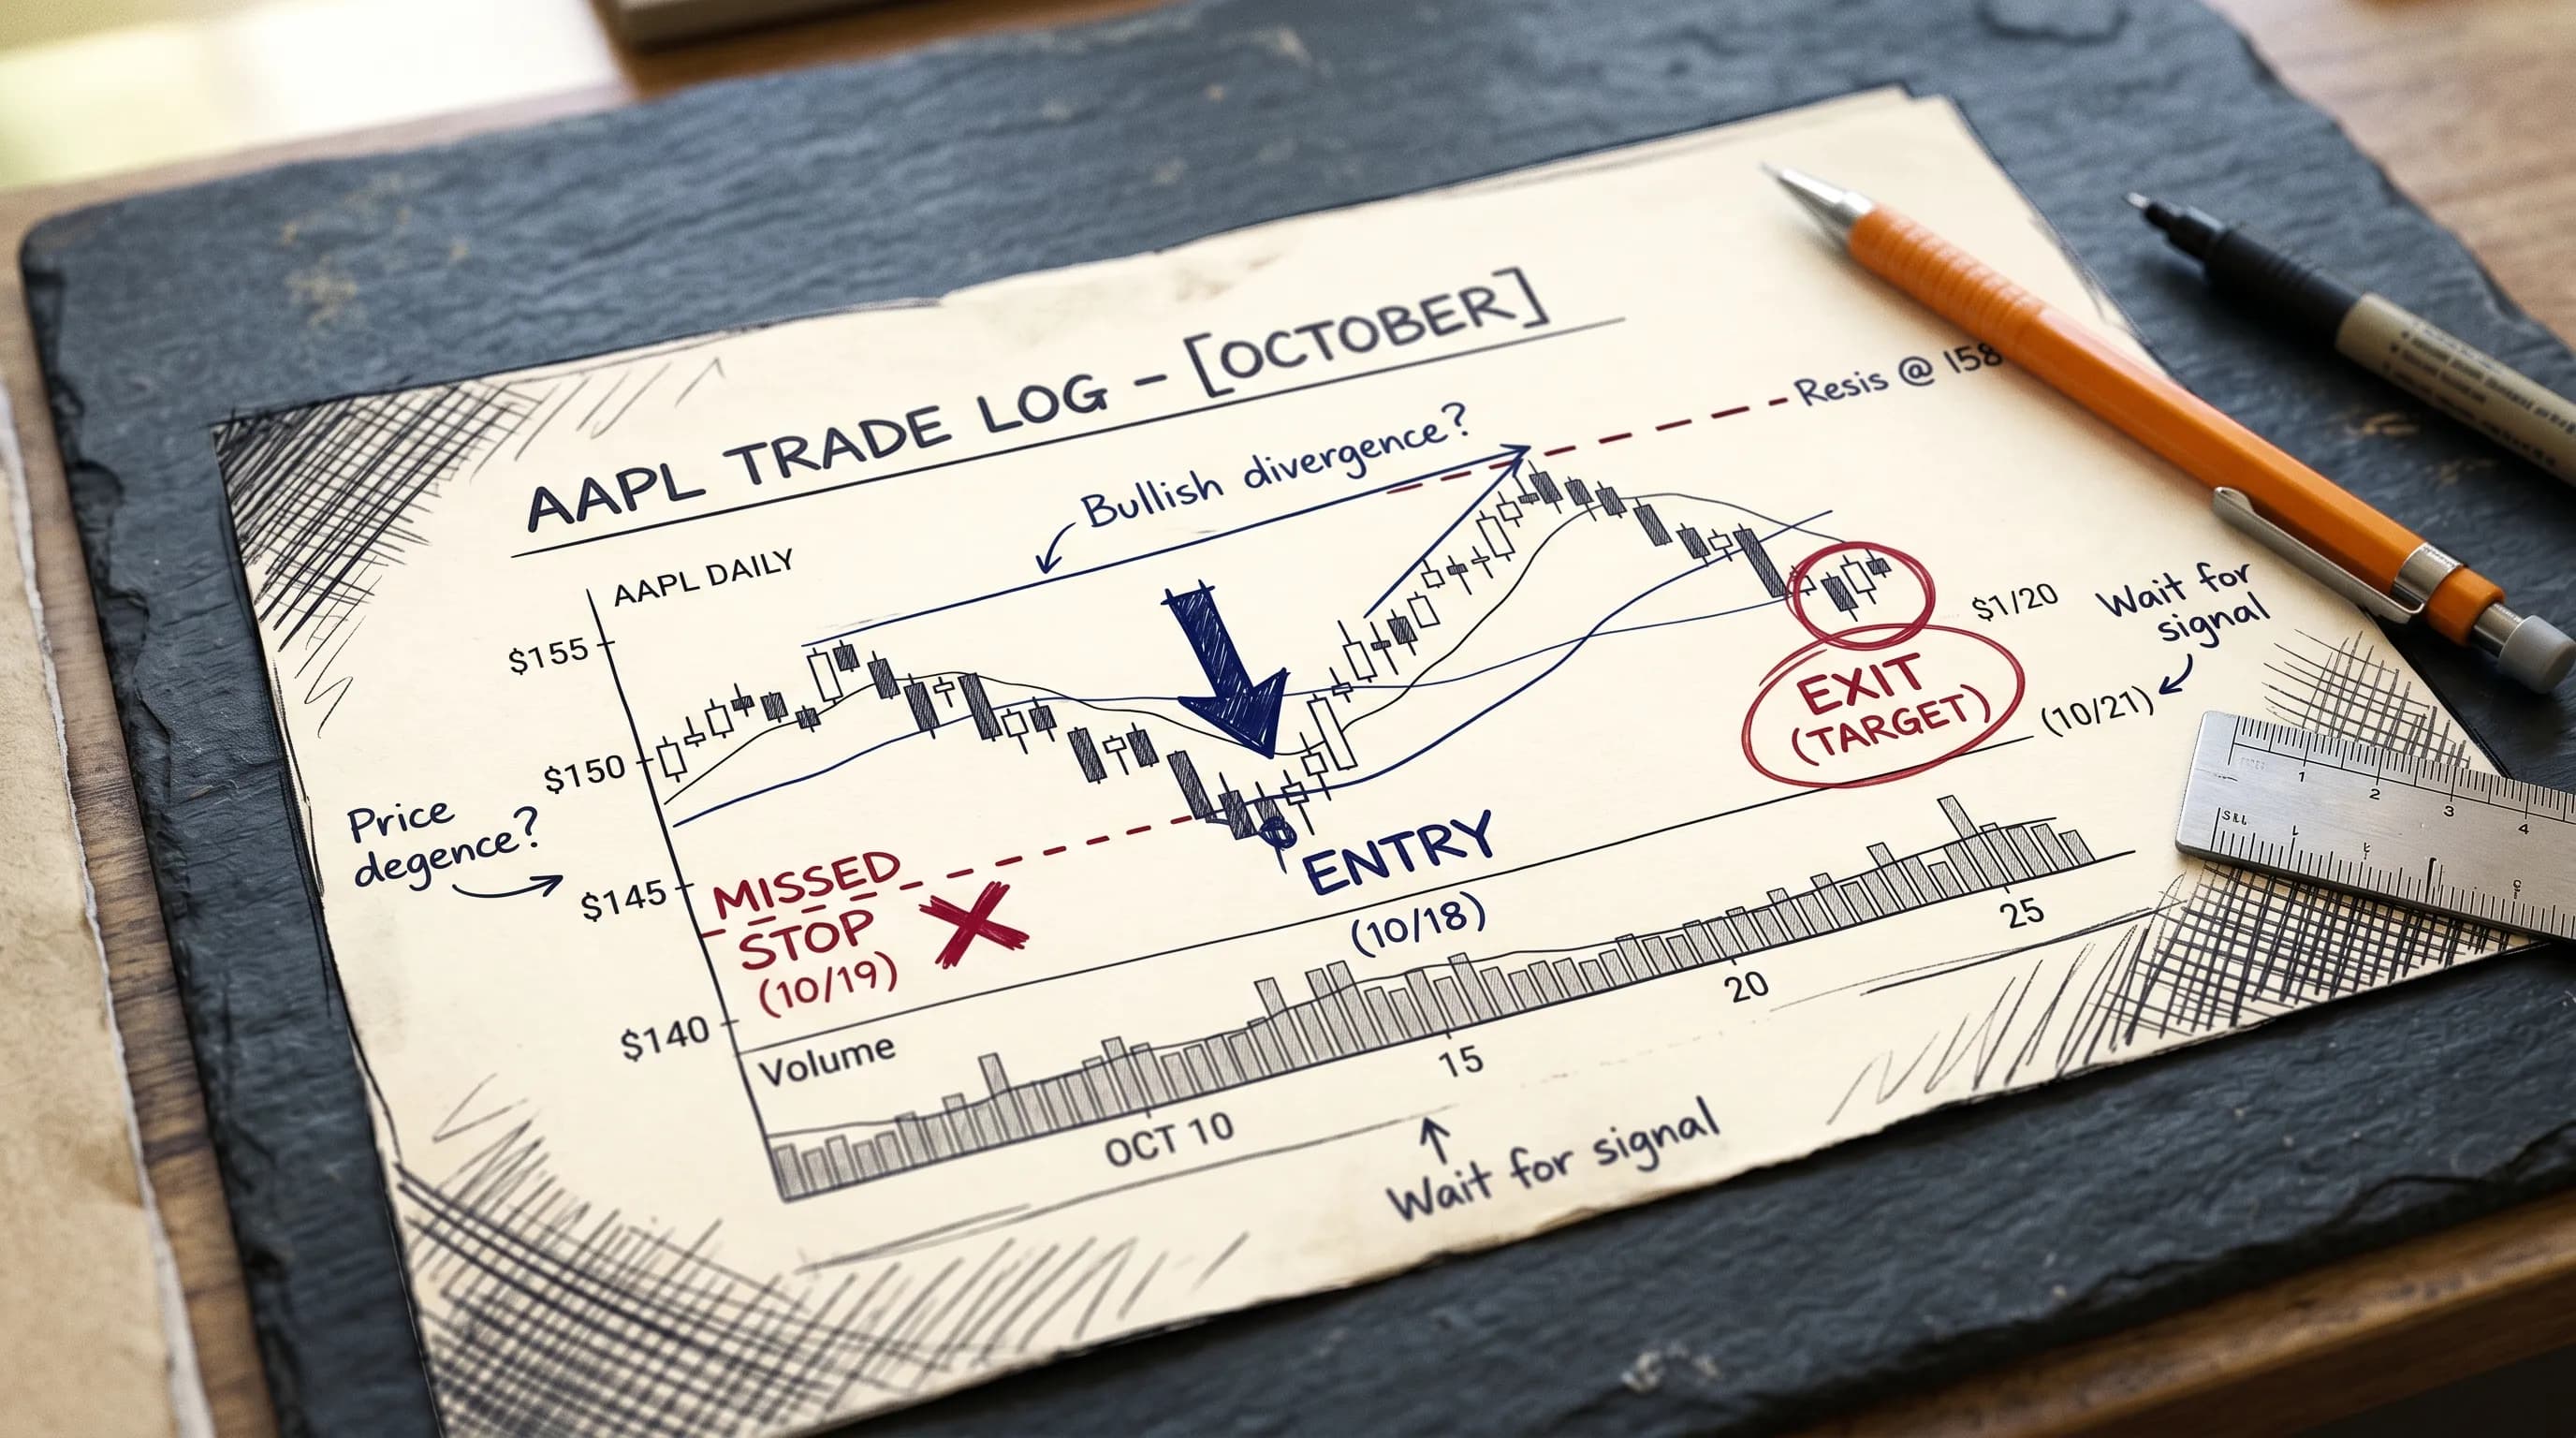
The third mistake is skipping the trade when it worked. Winning trades carry just as much diagnostic value as losing ones. If a AAPL long hit target but you almost closed it early, that near-miss is data. If you held a winning EURUSD trade through noise that should have stopped you out, that discipline should be noted and reinforced — not ignored because the number was green.
Good pre-trade planning sets the benchmark. Trade analysis then measures what actually happened against that benchmark. Without both sides, you're only telling half the story.
The Difference Between Manual Review and Automated Analysis
Manual trade review — spreadsheets, notebooks, end-of-day logs — is better than nothing. But it has hard limits.
You can only see what you choose to look at. You can only spot patterns your eyes can find. And the more trades you take, the less realistic manual review becomes. A day trader taking 10 to 15 trades a session cannot manually review every trade meaningfully by end of day.
Automated trade analysis solves this by working on your full dataset, not the trades you remembered to check. It calculates MFE, MAE, efficiency, and R-multiple across your entire history. It tags behavioural patterns without you having to categorise each trade by hand. It surfaces the EURUSD morning session problem you'd never have noticed across 200 individual log entries.
This is also where the connection to an AI trading journal becomes concrete. Rather than reviewing trades passively, you can ask questions of your data directly: "Show me every trade where I exited before hitting MAE." "What's my efficiency on breakout entries vs. pullback entries?" The answers come from your own history — not general advice.
How ChartWise Functions as a Trade Analyzer
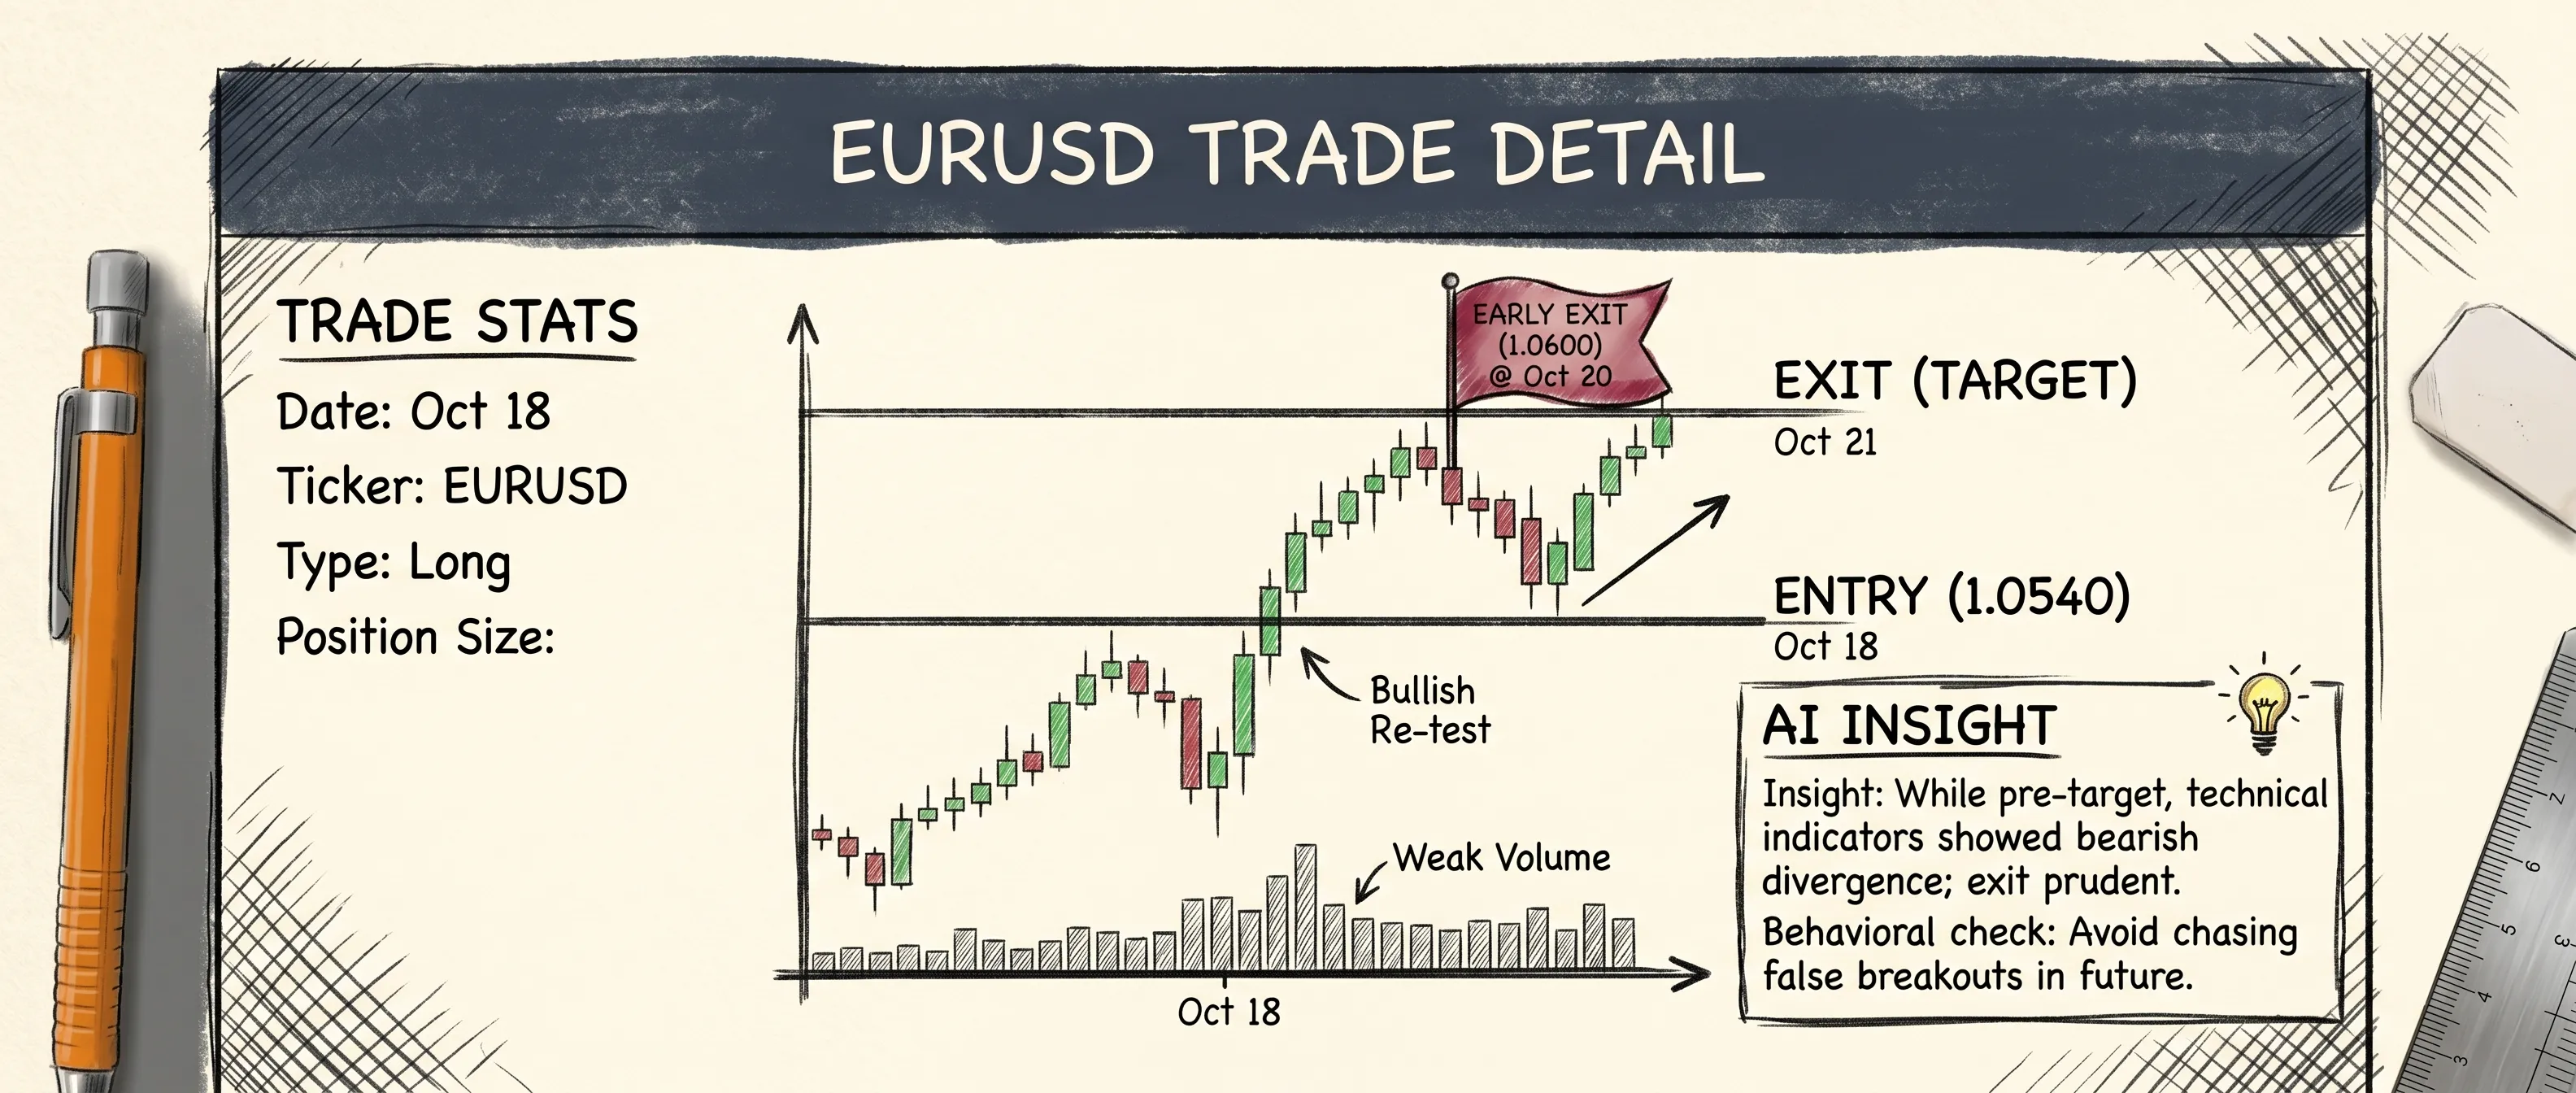
ChartWise's trade analyzer sits at the centre of the post-trade workflow. When a trade closes, the platform auto-logs the entry, exit, duration, and key metrics — including MFE, MAE, efficiency, and R-multiple. No manual entry required.
The Trade Detail Page then gives you a full breakdown of that single trade: the chart with entry and exit points marked, the full metric set, behavioural flags if applicable, and an AI-generated insight that highlights what the data suggests about the decision. If you closed a GBPJPY long before its MFE peak on three separate occasions this week, the system connects those dots and surfaces them — with context, not just a number.
Across your full trade history, the trading performance tracker view shows where your edge lives and where it breaks down. Sorted by instrument, session, setup type, or time of day — the patterns that cost you edge become visible in a way that's impossible to see one trade at a time.
The AI Trade Assistant layer lets you go further. Ask it to show you early exits from the London session in the last 30 days. Ask it to compare your AAPL entries against your EURUSD entries on efficiency. Ask it whether your R-multiple has improved or deteriorated over the last eight weeks. It pulls from your actual data, gives a direct answer, and surfaces the next logical question.
If Monte Carlo simulation is about stress-testing your strategy in the abstract, trade analysis is about stress-testing the decisions you actually made. Both matter. But the trade analyzer is where the real feedback loop lives — session by session, trade by trade.
Building a Review Habit That Actually Sticks
The traders who improve fastest aren't necessarily the ones doing the most thorough reviews. They're the ones doing consistent, focused reviews — and doing them close to the trade.
A simple framework that works:
Immediately after the trade closes: Note one thing. Was it on-plan or off-plan? That's it. Thirty seconds.
End of session: Look at the full session. Check MFE vs. actual exit on your biggest trades. Flag any behavioural tags.
End of week: Run the aggregate view. What patterns showed up this week that also showed up last week? What improved? What got worse?
The weekly review is where why traders lose money stops being a vague question and starts having a specific, data-backed answer. Not "I made emotional decisions" — but "I exited 4 of 7 trades before MFE on Wednesday afternoons when GBPUSD was ranging."
That level of specificity is what separates traders who talk about improving from traders who actually do.
Conclusion
A trade analyzer isn't about finding fault. It's about finding signal in a dataset that would otherwise stay invisible.
Every trade you take contains information — about your execution, your decisions, your patterns under pressure. Most of that information disappears if you don't capture it. The traders who build edge over time are the ones who treat post-trade analysis as part of the trade itself, not an optional add-on once the position is closed.
The tools exist to make this automatic. The habit is what you build on top of them.
Want to see what your trade data actually says? Join the ChartWise waitlist and be among the first to access AI-powered trade analysis built around how traders actually work.
FAQ:
Q1: What is a trade analyzer?
A trade analyzer is a tool that breaks down completed trades by examining entry and exit decisions, key performance metrics like MFE, MAE, and R-multiple, and behavioural patterns across your trade history. It goes beyond win/loss to show you what actually drove each outcome.
Q2: What metrics does a trade analyzer track?
The core metrics are Maximum Favourable Excursion (MFE), Maximum Adverse Excursion (MAE), entry and exit efficiency, R-multiple, and hold time. Better tools also track behavioural tags such as early exits, revenge entries, and trades taken outside your defined rules.
Q3: How is a trade analyzer different from a trading journal?
A trading journal records what happened. A trade analyzer interprets it — calculating metrics, surfacing patterns across multiple trades, and flagging behavioural tendencies that a manual log would miss. The two work together: the journal captures the data, the analyzer makes sense of it.
Q4: Can a trade analyzer work for day traders?
Yes — and it's arguably more important for high-volume traders. Day traders taking 10+ trades per session cannot manually review every trade meaningfully. Automated trade analysis processes the full dataset and surfaces patterns that manual review would never catch.
Q5: How does ChartWise function as a trade analyzer?
ChartWise auto-logs every trade on close, calculates MFE, MAE, efficiency, and R-multiple without manual input, and displays a full breakdown on the Trade Detail Page — including an AI-generated insight based on your specific data. The AI Trade Assistant then lets you query your full history in plain language.