
Most traders backtest a strategy, see it performed well historically, and assume it will keep performing. That assumption is the problem.
A backtest runs your strategy through one version of history — in one specific order, with one specific sequence of trades. But markets do not repeat in the same sequence. A strategy that looks solid in backtesting can look very different when the trade order shifts, when a losing streak clusters early, or when randomness lines up against you.
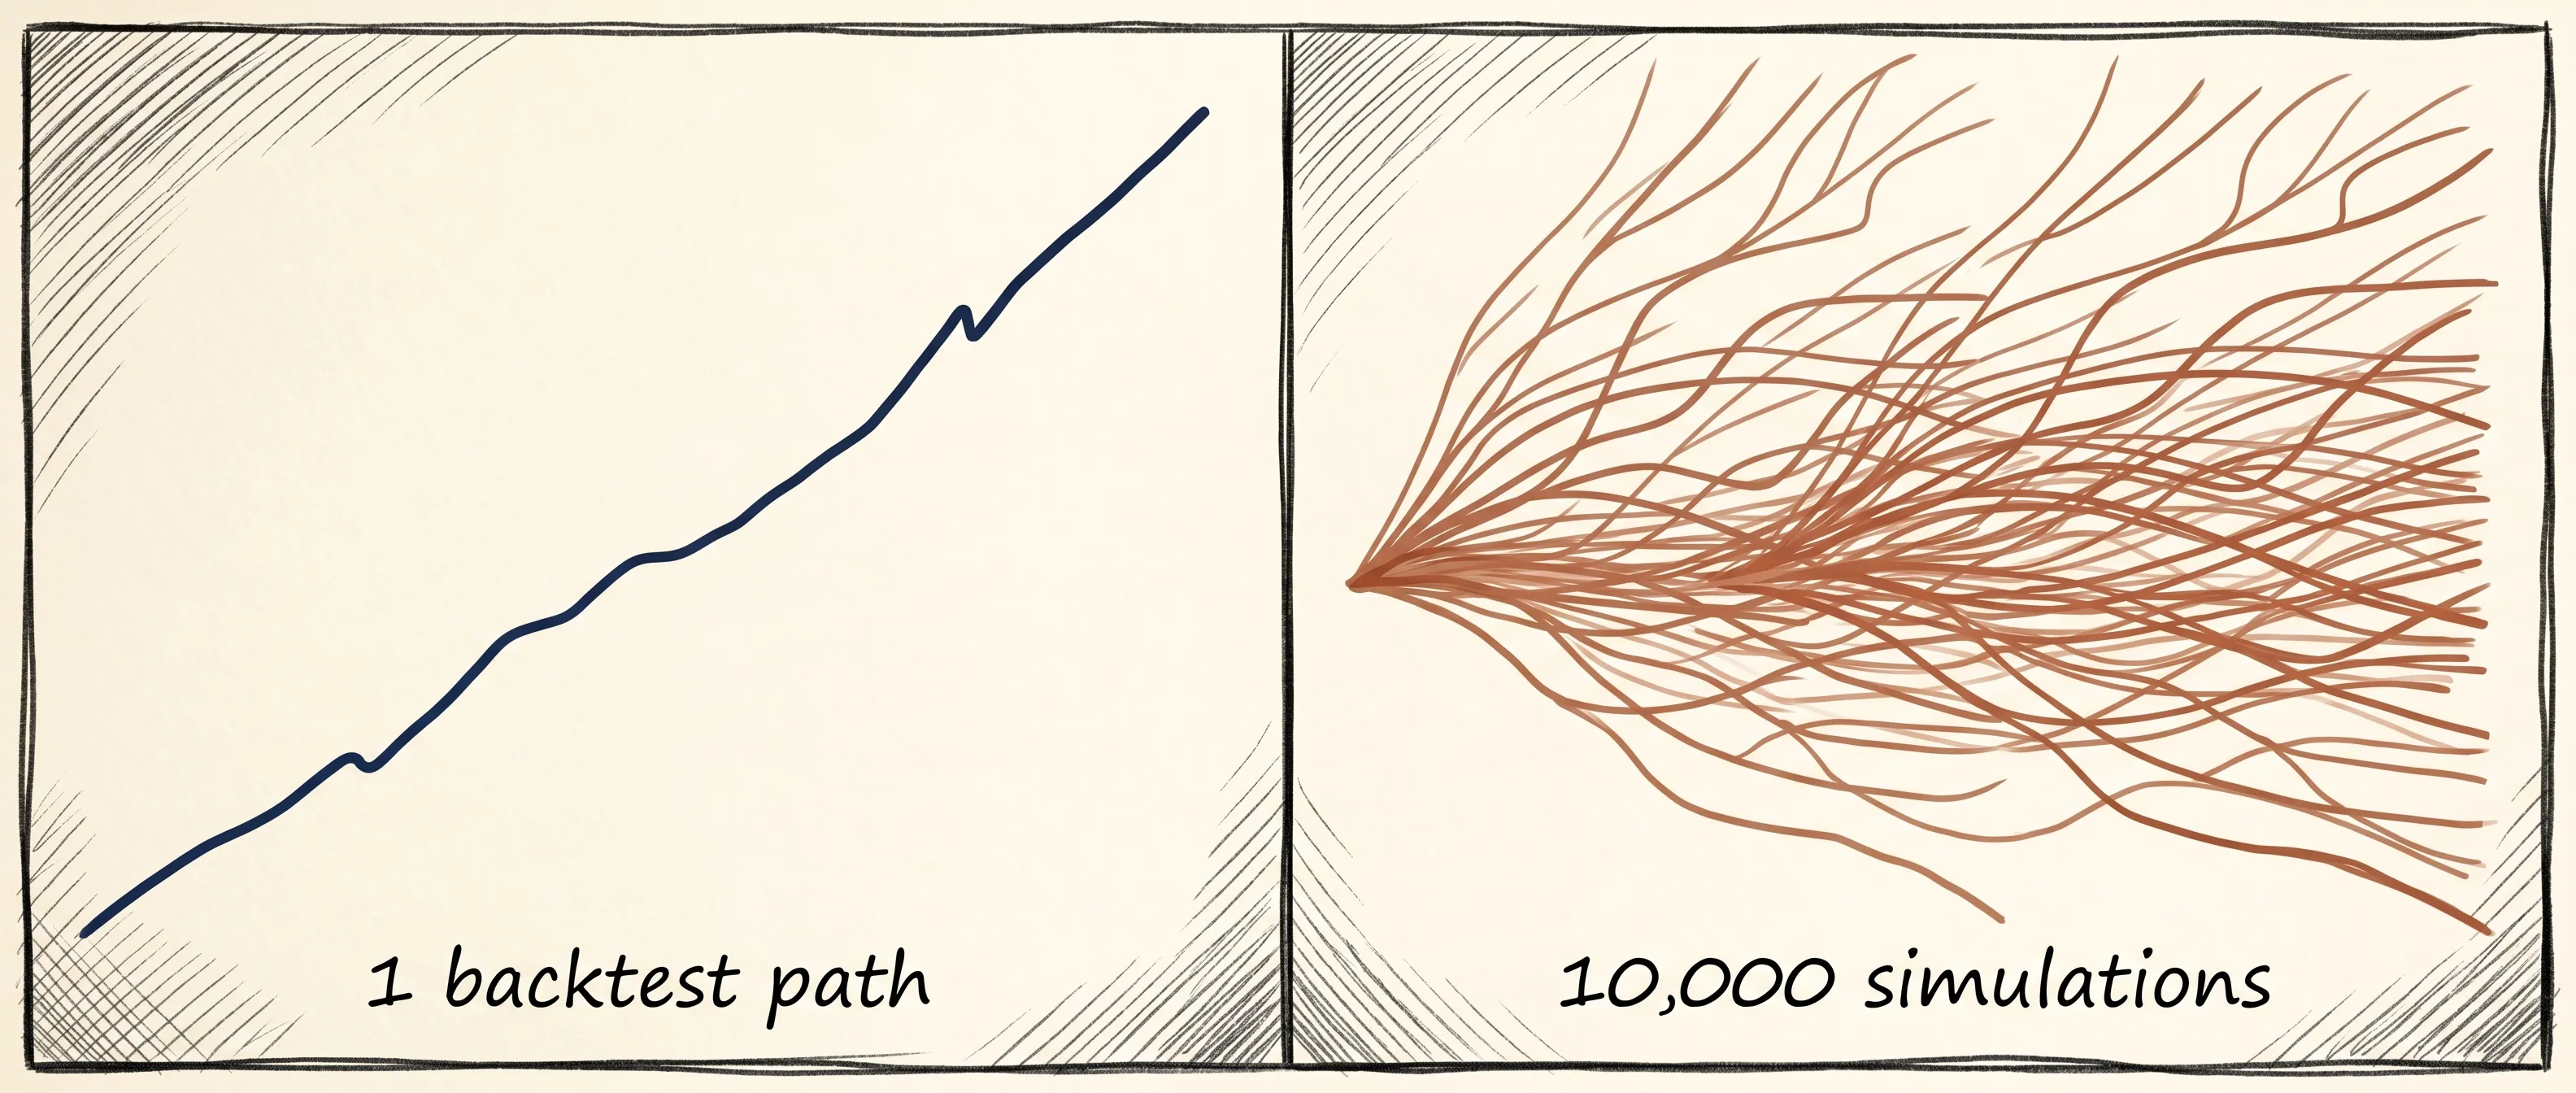
Monte Carlo simulation fixes that. Instead of running your strategy through history once, it runs it through thousands of randomised versions — shuffling the sequence, stacking scenarios, and showing you the full range of what your strategy might actually do. The result is not a single equity curve. It is a distribution of possible outcomes, and what lives inside that distribution is the information that actually matters.
What Is Monte Carlo Simulation in Trading?
Monte Carlo simulation is a mathematical method that uses repeated random sampling to model the range of possible outcomes for a given strategy.
In trading, it takes your historical trade results and runs them in thousands of different random sequences. Each simulation produces a different equity curve. When you stack ten thousand of those curves on top of each other, you do not see one line — you see a band of possible futures, from the optimistic to the severe.
The name comes from the Monte Carlo Casino in Monaco, referencing the role randomness and probability play in the model. The method was developed in the 1940s by mathematicians and has since been applied across finance, engineering, and physics.
For traders, it answers a question that backtesting alone cannot: given a strategy with these trade results, what is the realistic range of what might happen next?
Why Backtesting Alone Is Not Enough
When you backtest a trading strategy, you are running one simulation — the one that actually happened, in the exact sequence it happened. That tells you whether your strategy had an edge in the past. It does not tell you how fragile or robust that edge is.
Consider two traders with identical win rates, average risk-to-reward ratios, and total trade counts. One experiences their losing trades spread evenly across six months. The other hits a cluster of eight consecutive losses in week two. Their annual results may be identical — but their drawdowns and their psychological experience are completely different.
Backtesting would show both traders the same result. Monte Carlo simulation would show the probability of that losing cluster occurring, and whether an account could survive it.
This is the gap Monte Carlo fills: it moves you from what happened to what could happen — which is the only thing that matters going forward.
What Monte Carlo Simulation Actually Measures
A well-built Monte Carlo simulation will output several key metrics across all simulated runs.
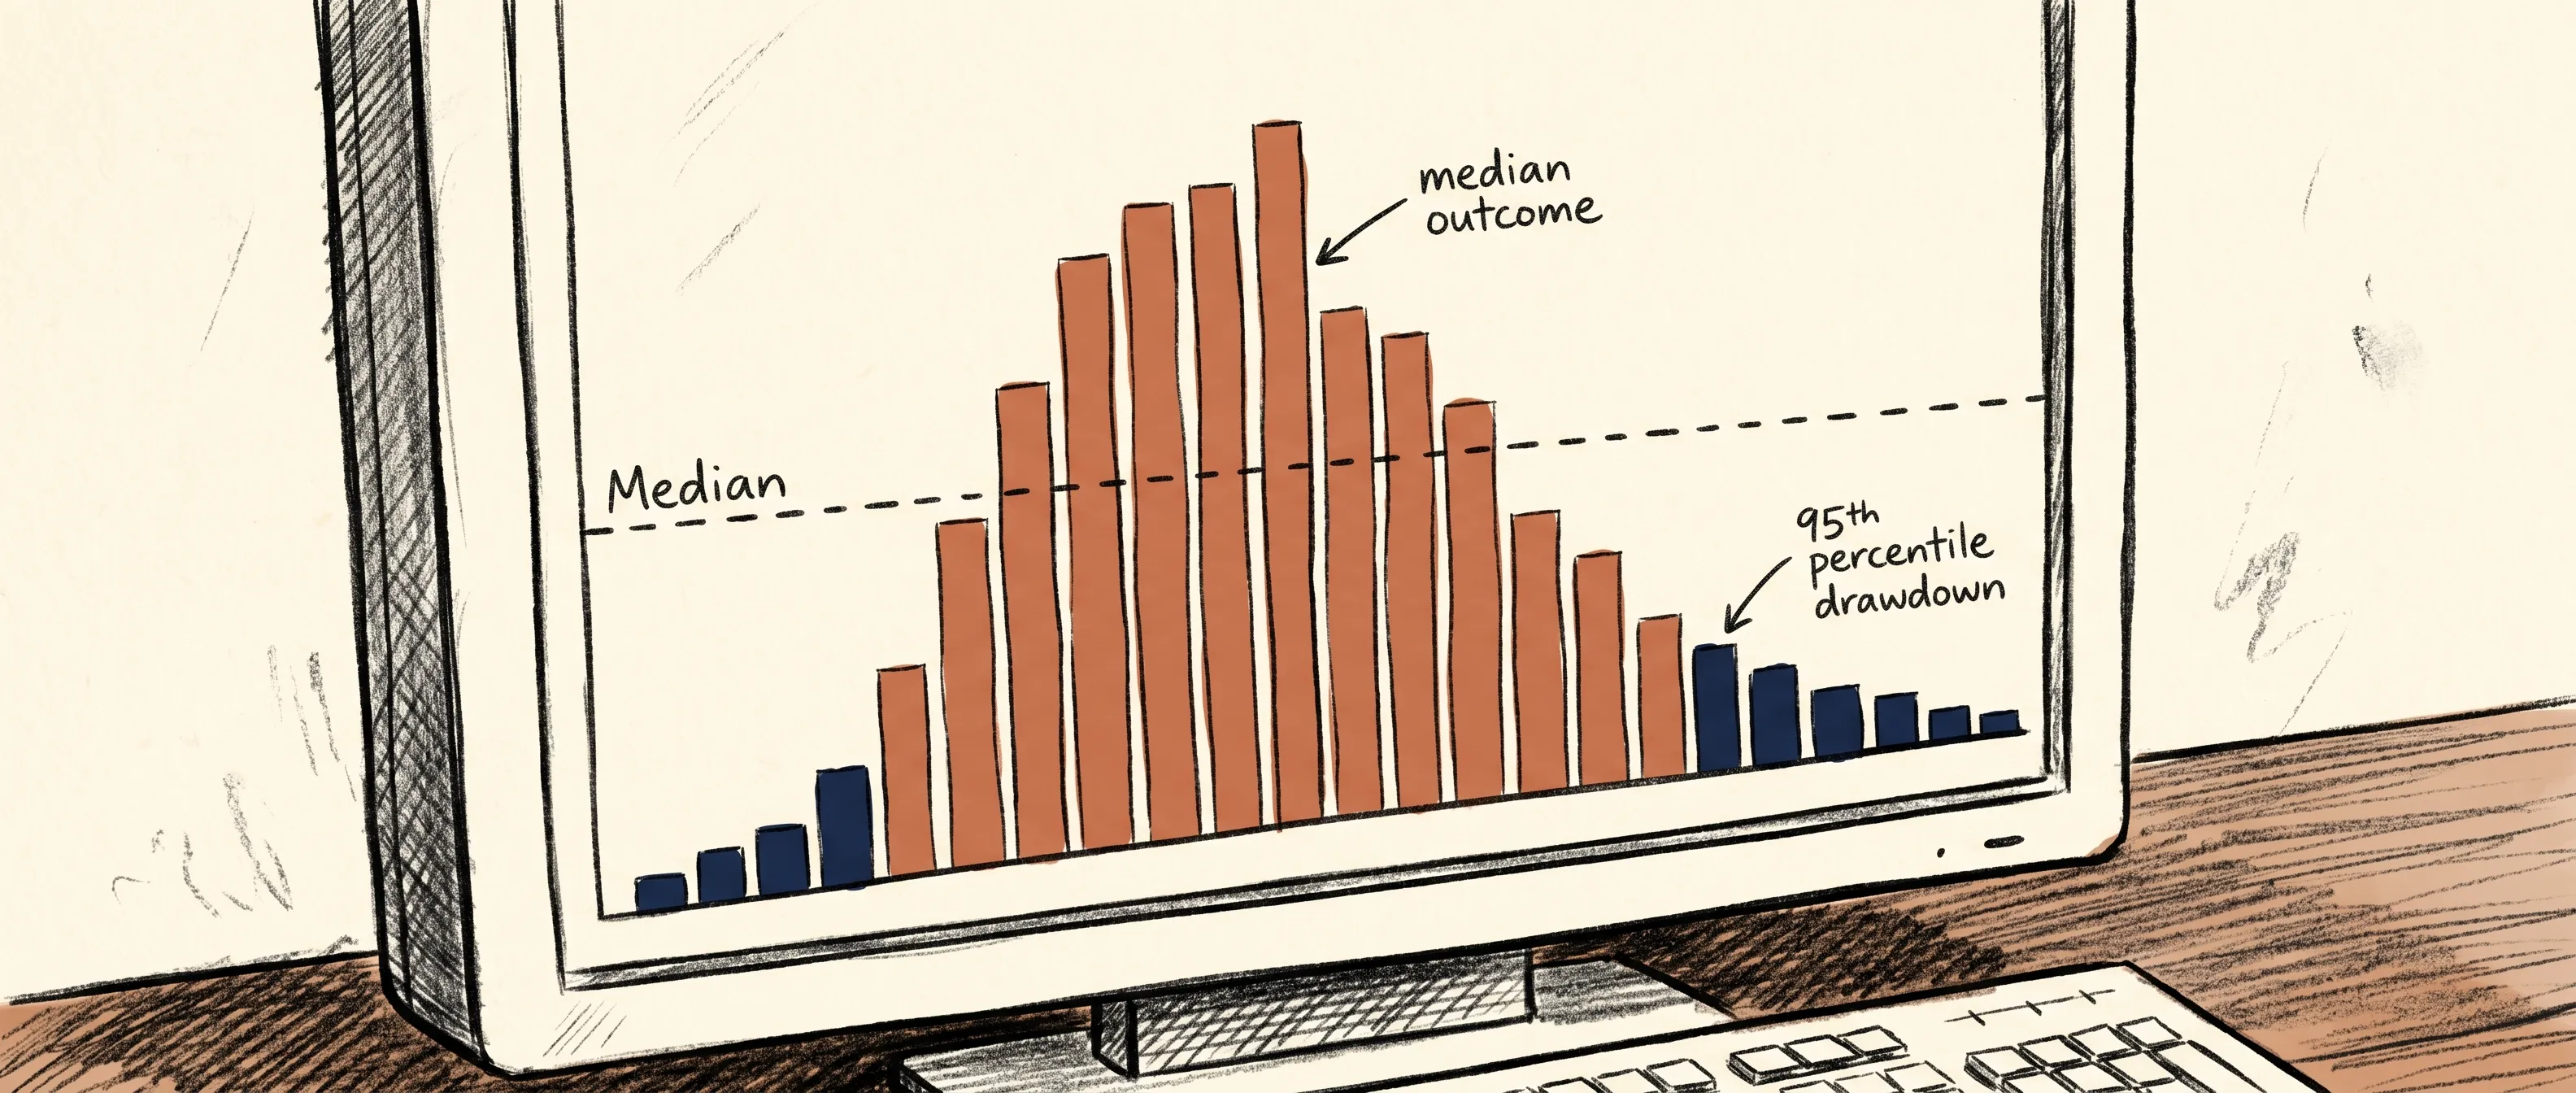
Drawdown distribution. Not just your maximum historical drawdown, but the range of drawdowns possible across thousands of scenarios. Your backtest might show an 8% maximum drawdown while Monte Carlo puts the 95th percentile drawdown at 22%. That is the number worth planning for.
Equity curve range. At any point in time, the simulation shows you the best, worst, median, and confidence-interval outcomes for your strategy. This gives you a realistic picture of where your account might sit after 50, 100, or 500 trades.
Probability of ruin. The percentage of simulated runs where the account falls below a defined threshold — often 20% or 50% of starting capital. If 12% of simulated runs result in a severe drawdown, that is a risk worth understanding before live capital is deployed.
Streak analysis. The probability of experiencing a specific number of consecutive losses. If your strategy has a 40% win rate, how likely is a run of seven losses in a row? Monte Carlo tells you. The answer is usually more likely than most traders expect.
How Monte Carlo Simulation Works Step by Step
1. Collect your trade sample. You need a representative set of trade results — ideally 50 to 200 trades from a consistent period. These become the raw material for the simulation.
2. Randomise the sequence. The simulation shuffles those trades into thousands of different orderings. Each ordering represents a plausible version of how those trades might have unfolded in real time.
3. Simulate the equity path. For each ordering, the simulation calculates the running account balance trade by trade, producing one equity curve per run.
4. Aggregate the results. Across all runs, the model computes distributions for drawdown, final balance, streak length, and ruin probability. This is the output that becomes useful.
5. Adjust position sizing accordingly. If the simulation reveals that your worst-case drawdown is larger than you can tolerate, the answer is not to abandon the strategy — it is to reduce position size until the worst-case scenario is one you can actually sustain.
Reading Monte Carlo Output: What to Look For
When you run a Monte Carlo simulation, the output can look complex. Here is how to read it clearly.
Focus on the 95th percentile, not the worst case. The absolute worst-case run is a tail event. The 95th percentile drawdown — meaning 95% of simulations produced a smaller drawdown than this number — is what to design your position sizing around.
Look at the median outcome, not the mean. In skewed distributions, the mean can be pulled by outliers. The median equity curve tells you what the middle of the distribution looks like — the most representative outcome.
Check ruin probability at your actual position size. If you are risking 2% per trade and the simulation puts ruin probability at 8%, that number needs to come down before you trade live.
Treat high variance as a signal, not just a statistic. A wide spread between the 5th and 95th percentile equity curves means your strategy's outcome is highly sensitive to trade sequencing. That is useful information — it means you need more conservative sizing, or that your sample size may not yet be large enough to draw firm conclusions.
Common Mistakes When Using Monte Carlo Simulation
Using too small a sample. Fewer than 30 trades produces output that reflects randomness more than the strategy itself. Aim for at least 50, preferably over 100 trades before running meaningful simulations.
Treating results as predictions. Monte Carlo does not tell you what will happen. It tells you the distribution of what might happen. The difference matters. No simulation eliminates uncertainty — it makes uncertainty quantifiable.
Ignoring correlation between trades. Standard Monte Carlo shuffles treat each trade as independent. In reality, trades in the same market or on the same day can be correlated. A good simulation tool accounts for this, or you factor it into how you interpret results.
Using Monte Carlo to justify a strategy that failed backtesting. Monte Carlo simulation is a stress test, not a rescue. If a strategy shows no historical edge, running it through a simulation will simply show you thousands of ways it can underperform.
How ChartWise Uses Monte Carlo Simulation
ChartWise builds Monte Carlo simulation directly into the analytics layer, running it on your actual trade history rather than requiring you to export data and use a separate tool.
When you have logged enough trades, ChartWise runs thousands of simulations on your real results — showing you the equity curve distribution, drawdown range, and ruin probability based on how you actually trade. The output connects directly to the trading performance tracker and behavioral trading analysis, so you can see not just whether your strategy is robust, but where in your behavior the variance is coming from.
The practical output: you can see whether your current position size is sustainable, where your realistic drawdown ceiling sits, and what sample size you need before results become statistically reliable. For traders working on trading consistency, this shifts the conversation from am I having a bad run to where does this run fall in the distribution of expected outcomes — which is a much more useful question to be asking.
Who Should Use Monte Carlo Simulation
Monte Carlo simulation is useful for any trader who has a defined strategy and enough trade history to run it through. It is particularly valuable for:
Traders who have completed a backtest and want to understand how robust the results actually are
Traders sizing up from paper trading or small accounts to live capital
Traders who have experienced a drawdown and want to know whether it falls within expected variance or signals a real edge deterioration
Prop firm traders managing specific drawdown limits who need to understand their statistical risk of hitting those thresholds
If you are building trading consistency and want to know how your strategy holds up under realistic adverse conditions — rather than only the favourable sequence your backtest happened to run through — Monte Carlo simulation is the most honest tool available.
The Honest Answer Monte Carlo Gives You
Most traders want a single number: a backtest result, a win rate, a risk-to-reward ratio. Monte Carlo simulation refuses to give you that. It gives you a distribution instead — a range of honest answers that includes the uncomfortable ones.
That discomfort is the point. The scenarios that feel extreme in simulation are not hypothetical. They are plausible versions of what can happen when real capital is at stake. Knowing where they live in the distribution, and designing your approach so you can survive them, is what separates traders who are still active two years later from those who were not.
Your strategy does not need to be perfect. It needs to be robust enough that the worst realistic scenario does not end your trading. Monte Carlo simulation tells you whether it is.
FAQ
What is Monte Carlo simulation in trading?
Monte Carlo simulation is a method that runs your strategy through thousands of randomised trade sequences to show the full range of possible outcomes — including worst-case drawdowns and ruin probability — rather than a single backtest result.
How many trades do I need for Monte Carlo simulation?
A minimum of 50 trades is generally recommended to produce meaningful output. Fewer trades increase the influence of randomness over the actual strategy signal. Over 100 trades produces more reliable results.
Is Monte Carlo simulation accurate?
Monte Carlo simulation is not a prediction — it is a probability distribution. It accurately models the range of outcomes possible given your historical trade results, but cannot account for structural market changes or conditions not represented in your sample.
What is ruin probability in Monte Carlo simulation?
Ruin probability is the percentage of simulated runs in which the account falls below a defined threshold — for example, losing 50% of starting capital. It is used to assess whether a given position size is statistically viable over time.
How does ChartWise use Monte Carlo simulation?
ChartWise runs Monte Carlo simulation directly on your logged trade history, producing equity curve distributions, drawdown ranges, and ruin probabilities based on how you actually trade — without requiring any manual data export.