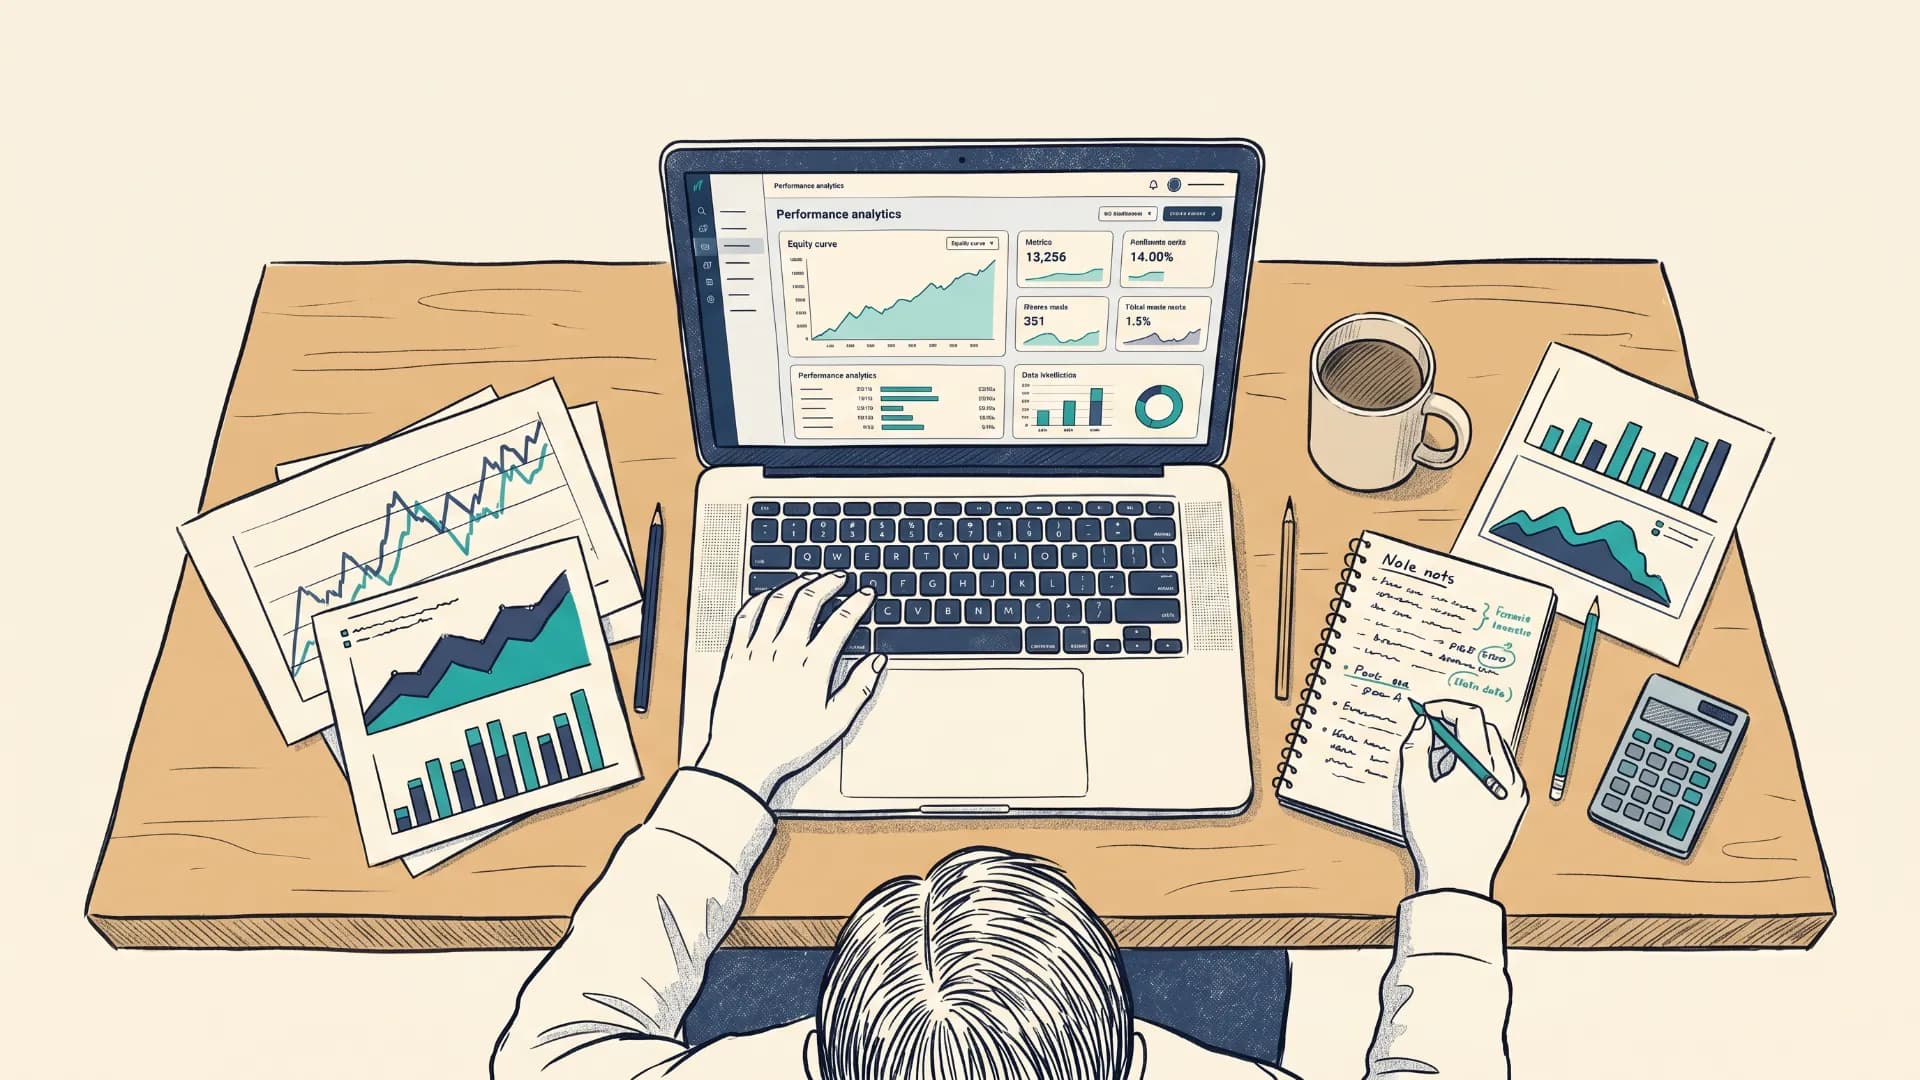
Most traders know roughly how they're doing. They have a sense of whether last week was good or bad, whether the month is up or down. What they don't know — and rarely stop to find out — is why.
That gap between knowing your results and understanding them is where most trading careers stall. You can trade for years without improving if all you're tracking is your account balance. The traders who actually get better aren't the ones who trade more. They're the ones who measure more — specifically, they use a trading performance tracker.
This guide covers what a performance tracker actually is, the metrics that matter, what the data reveals beyond the numbers, and how AI is changing what tracking can do for you.
What Is a Trading Performance Tracker?
A trading performance tracker is a tool that records your trades, calculates key metrics, and surfaces patterns in your trading over time. It goes well beyond logging entries and exits. It answers the question every serious trader needs to ask: does my strategy have a real edge — and am I executing it properly?
Think of it like a fitness tracker, but for your trading. A fitness tracker doesn't just count steps. It shows your heart rate trends, sleep quality, and recovery patterns. A trading performance tracker doesn't just show your results. It shows your win rate by setup, your drawdown by session, your profit factor over the last 90 days — and the behavioral patterns underneath all of it.
A basic trade log records what happened. A performance tracker explains what it means.
Many traders confuse the two. They keep a spreadsheet with entries, exits, and results — and believe they're tracking performance. They're not. They're collecting data without analysing it. The analytical layer is what turns a log into a tracker, and a tracker is what turns experience into actual skill.
For this reason, a proper trading journal should always include performance tracking built in — not as a separate step, but as the engine underneath the journaling habit itself.
The Metrics That Actually Matter
There are dozens of trading metrics. Most of them are noise. These are the ones that tell you something real.
Win Rate
Win rate is the percentage of trades that close in your favour. It is the most talked-about metric and also the most misused. A 65% win rate sounds impressive until you discover that the average winner is half the size of the average loser. Win rate only means something when paired with risk-reward.
Risk-Reward Ratio
Your risk-reward ratio measures what you make on average relative to what you risk per trade. A 1:2 ratio means you make $2 for every $1 at risk. A trader with a 40% win rate and a 1:3 R:R is far more profitable than one with 70% win rate and a 1:0.8 R:R. Together, these two metrics determine whether your strategy has a mathematical edge at all.
Profit Factor
Profit factor is total gross wins divided by total gross losses. Above 1.0 means you're profitable overall. Above 1.5 is solid. Above 2.0 is strong. It's a single number that captures the overall quality of your strategy's output — and it cuts through the noise faster than almost any other metric.
R-Multiple
R-multiple measures each trade's outcome in units of risk rather than dollars. A trade where you risked $100 and made $300 is +3R. A trade where you risked $100 and lost $60 is -0.6R. Tracking in R-multiples removes the distortion that comes from variable position sizes and makes it much easier to compare performance across different instruments, strategies, and market conditions.
Maximum Drawdown
Max drawdown is the largest peak-to-trough decline in your equity over a given period. It tells you the worst case your strategy has historically produced — and whether your risk management can survive it. Most traders have no idea what their drawdown looks like until it's happening to them in real time, at which point it's already a problem.
Expectancy
Expectancy is the average amount you can expect to make per trade, calculated as: (Win Rate × Average Win) minus (Loss Rate × Average Loss). Positive expectancy means your strategy has a genuine edge. Negative expectancy means you're bleeding slowly — even if individual weeks feel profitable.
Sharpe and Sortino Ratios
These measure risk-adjusted returns. The Sharpe Ratio compares your return to total volatility. The Sortino Ratio penalises only downside volatility. Both tell you whether the returns you're generating are proportionate to the risk you're taking to get them.
MFE and MAE
Maximum Favorable Excursion and Maximum Adverse Excursion measure how far a trade moved in your favour — and against you — before you exited. If your MFE is consistently much higher than where you actually exited, you're leaving significant gains unrealised. If your MAE is large on losing trades, you're staying in losers too long. These two metrics reveal the quality of your exits more clearly than anything else.
What a Tracker Reveals Beyond the Numbers
Raw metrics capture performance. The patterns underneath them explain it.
Time-Based Patterns
Are your best trades happening in the first hour of the session? Are Fridays consistently dragging on your numbers? Performance trackers surface this automatically. What feels like random variance usually has a structural cause, and the data makes it visible before it costs you further.
Setup-Based Performance
Not all your setups perform equally — even if they feel like they do. A tracker lets you break down performance by strategy type, instrument, timeframe, and custom tags. You may discover that one of your five setups generates nearly all of your edge, while the others are neutral at best. That finding alone changes how you trade.
Behavioral Patterns
This is where performance tracking overlaps with psychology. When you filter your trades and look at behavioral patterns in your trading, what you find is often uncomfortable: more trades placed after a loss, larger positions after a winning run, exits that are consistently too early when you're in profit. These aren't random. They're patterns — and they cost real money. You can only fix what you can first see.
Position Sizing Consistency
A tracker shows whether your position sizing is consistent with your risk rules across all your trades. Erratic sizing — going bigger when confident, smaller when nervous — is one of the most common ways a trader undermines an otherwise sound strategy. The data makes the inconsistency undeniable.
How to Use a Performance Tracker Properly
Collecting data is only the first step. The value is in reviewing it on a consistent schedule.
Daily. After each session, log your trades with context — setup type, market conditions, how execution felt. This takes five minutes and keeps the data clean.
Weekly. Review your key metrics for the week. Look for sessions or setups that are dragging on your numbers. Check whether your actual R:R matched your target R:R.
Monthly. Do a deeper review. Compare expectancy, profit factor, and drawdown to prior months. The question to ask: is my edge holding up, improving, or eroding?
The goal is not to analyse every trade obsessively. It's to build a feedback loop — a process that turns experience into genuine skill, rather than just accumulated screen time.
How AI Is Changing Performance Tracking
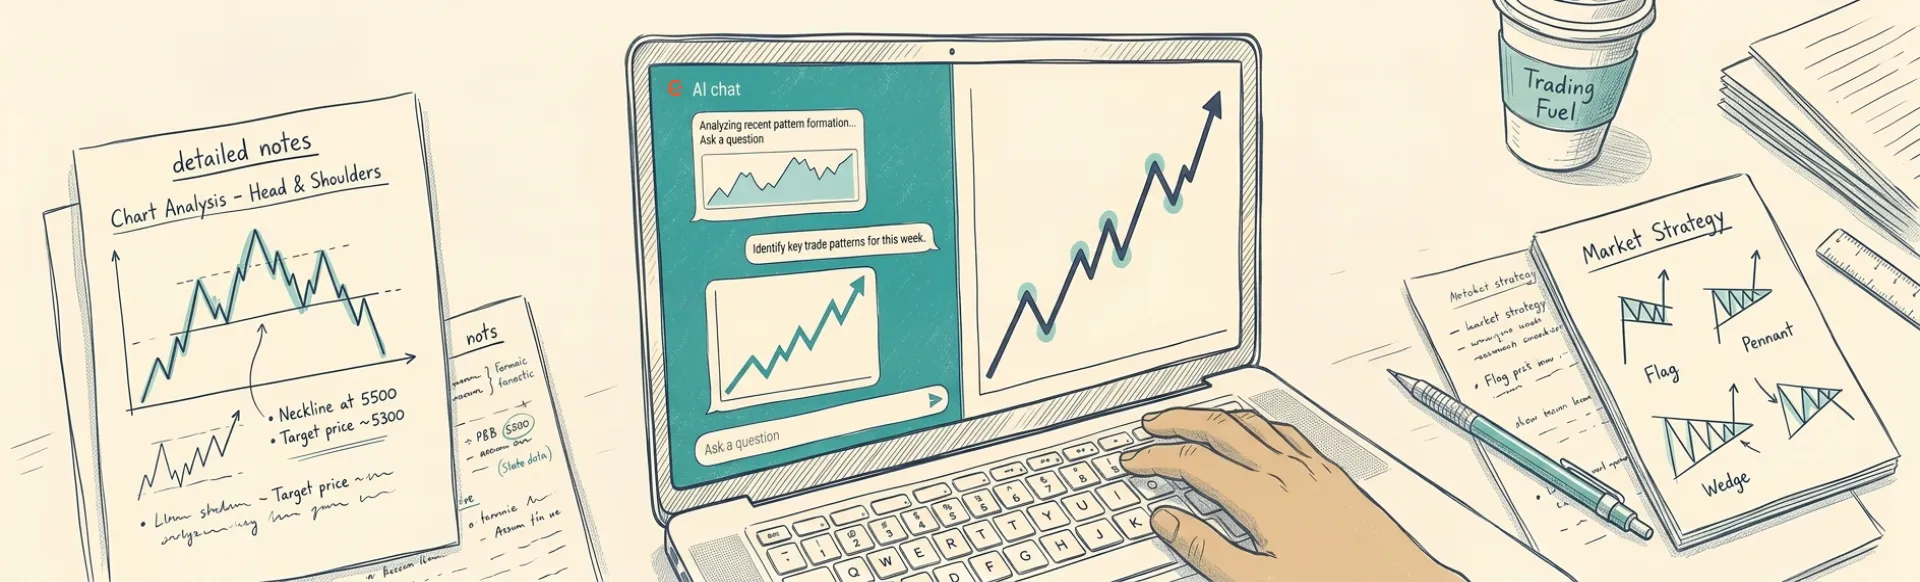
Traditional performance trackers show you what happened. AI-powered platforms help you understand why — and what to change.
An AI trading assistant can scan months of trade data and surface patterns that would take hours to find manually. It can answer questions like "what's my best-performing setup in trending conditions?" or "when do I tend to overtrade?" in seconds — without pivot tables, without manual filters.
It also adds context that static dashboards can't provide. Rather than just displaying your drawdown, it can identify the specific setups, sessions, and market regimes where your drawdown tends to cluster. That kind of insight doesn't just inform how you review — it changes how you trade.
ChartWise is built around this model. Performance analytics where AI doesn't sit on top of your data, but runs through every layer of it — metrics, patterns, behaviour, and execution quality together.

What to Look for in a Trading Performance Tracker
Automatic broker integration. Manual data entry is the fastest way to stop tracking consistently. Your tracker should connect to your broker directly and pull trade data without you having to do it.
Metric depth beyond win rate. If a platform only shows win rate and total result, it's a trade log, not a tracker. Look for profit factor, R-multiple, drawdown, expectancy, and Sharpe ratio at minimum.
Filtering and segmentation. You need to break down performance by strategy, instrument, session, and timeframe. Without filters, you can't isolate where your edge actually lives.
Behavioral pattern detection. The best platforms surface psychological patterns automatically — before you've already recognised them yourself.
AI analysis. Manual review takes hours and misses things. AI-powered platforms compress that work and find patterns that human review consistently overlooks.
The Bottom Line
A trading performance tracker is not an optional extra for traders who like data. It is the foundation that improvement is built on.
The traders who get consistently better are not the ones who trade more or study more charts. They're the ones who build feedback loops — tracking what they do, measuring what it produces, and making deliberate adjustments based on data rather than gut feeling.
The metrics are clear. The discipline is where most traders fall short. And the right platform makes that discipline far easier to maintain.
If you're ready to move past logging trades and start actually understanding your performance, ChartWise was built for exactly that.
FAQ
What is a trading performance tracker? A trading performance tracker is a tool that records your trades and calculates key metrics — win rate, profit factor, drawdown, R-multiple, and more — to give you a data-driven view of how your strategy is performing over time. Unlike a basic trade log, it provides analysis, not just records.
What metrics should I track as a trader? The most important metrics to track are win rate, risk-reward ratio, profit factor, R-multiple, expectancy, maximum drawdown, and Sharpe/Sortino ratio. Together they give you a complete picture of your edge, your risk exposure, and your execution quality.
What's the difference between a trade log and a trading performance tracker? A trade log records data — entries, exits, results. A trading performance tracker analyses that data and calculates metrics, surfaces patterns, and shows you whether your strategy has a real edge. A log tells you what happened. A tracker explains what it means.
How often should I review my trading performance? Daily reviews catch execution issues quickly. Weekly reviews surface setup or session-based patterns. Monthly reviews assess whether your overall edge is holding up or needs adjustment. Each serves a different purpose.
Can AI help with trading performance tracking? Yes. AI-powered trackers automatically surface behavioral patterns, answer natural language questions about your data, and identify performance trends that manual review would miss. Platforms like ChartWise use AI to make tracking faster, deeper, and more actionable.
What should I look for in a trading performance tracker? Look for automatic broker integration, a broad range of metrics beyond win rate, filtering by strategy and instrument, behavioral pattern detection, and AI-assisted analysis. The goal is a tool that turns your trade history into actionable insights — not just a better-looking spreadsheet.