Most traders who hit a rough patch do the same thing. They go back to their journal, look at the last five trades, try to find what went wrong, and tell themselves they will be more careful next time. Sometimes it works. More often, the same pattern reappears two weeks later in a slightly different form.
The problem is not discipline. It is not even analysis. It is the level at which the analysis is happening.
Reviewing individual trades tells you what happened in each trade. Trader behavior analytics tells you what you habitually do, the subtle patterns that repeat across dozens or hundreds of trades, often below the level of conscious awareness. This distinction changes everything about how you approach your data.
What Trader Behavior Analytics Actually Means
There is a difference between recording a trade and understanding the behavior behind it. Most journals are built for the former. You log entry price, exit price, result, and maybe a short note. Organized, clean, useful to a point.
Behavioral analysis in trading starts where that record ends. It asks a different set of questions. Not "what happened in this trade?" but "why do trades with this shape keep ending the same way?" Not "was this a good entry?" but "what does my entry timing look like across every setup taken in the first hour of the session?"
The answers live in your aggregate data, not in any single trade.
Trader behavior analytics covers patterns like whether your position sizing changes after a bad session, which signals reactive sizing rather than planned risk. It looks at whether your hold times shrink or expand depending on whether you are up or down on the day, which indicates emotional exit management rather than plan-driven exits. It examines whether your entry timing clusters around high-volatility moments that tend to precede reversals, which is a common FOMO entry pattern. And it surfaces whether the setups you take after midday perform meaningfully worse than your morning trades, a session bias many traders carry without ever formally identifying it.
None of this is visible on a trade-by-trade basis. It only emerges when the data is examined in aggregate, with behavioral pattern recognition as the analytical lens.
The Behavioral Patterns That Shape Most Traders' Results
Understanding trader behavior analytics starts with recognizing which patterns do the most damage across most trading accounts. These are not exotic edge cases. They show up consistently in the data of traders at every level of experience.
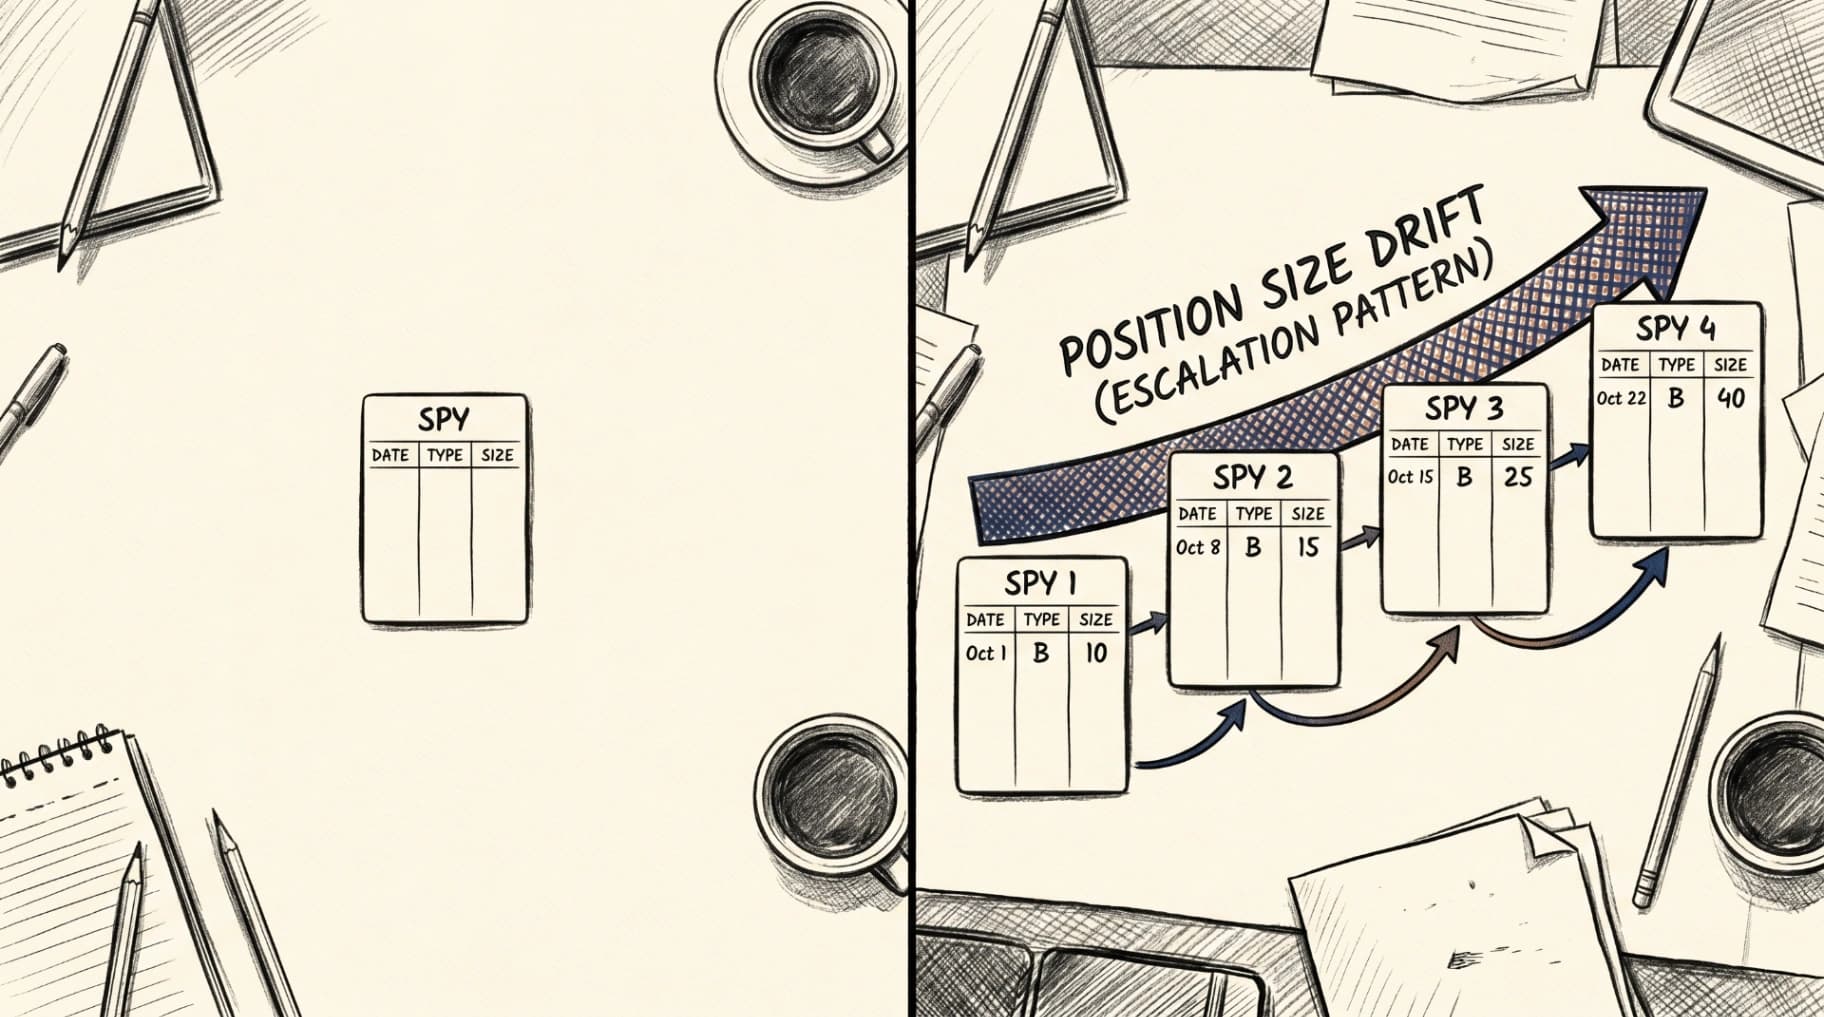
The first is reactive position sizing. A trader has a bad morning and, rather than reducing exposure, sizes up on the next trade to recover ground faster. The sizing decision looks intentional but is actually driven by the session's emotional arc. When this pattern appears repeatedly in your data, it shows up as a correlation between bad sessions and oversized subsequent entries. The behavioral trading analysis layer in a structured journal is designed to surface exactly this kind of signal, not because it diagnoses you, but because it makes the pattern visible where it was invisible before.
The second is hold time compression under pressure. Traders who are down on the day tend to exit winning trades faster than traders who are in a neutral or positive session, even when the setup and market structure are identical. You get out before the trade has time to develop because the emotional weight of the session is reshaping your exit decisions. Tracking this across sessions reveals whether your exits are driven by your plan or your current mood. This is the same gap that appears when you look at your Maximum Favorable Excursion scores over time. A shrinking MFE average is often less about market conditions and more about this behavioral compression.
The third pattern is setup quality drift. After a strong week, many traders begin taking setups that would not have passed their filters two weeks earlier. Confidence bleeds into slippage on criteria. The trades still get logged under the usual strategy tags, but the actual setup quality has degraded. Behavioral analytics flags this by tracking entry efficiency scores over time relative to the preceding session sequence. A steady decline in entry quality following a strong period is one of the most consistent patterns in trader data.
The fourth is session timing bias. Some traders consistently perform better in one session and worse in another, without ever having formally identified the pattern. If your EUR/USD trades taken between the London open and the early crossover outperform the same setups taken late in the New York session, that is behavioral data. Ignoring it means trading equivalent setups in very different personal conditions with equivalent confidence. The data in your trading performance tracker already holds this information. Trader behavior analytics is what makes it readable.
Why Individual Trade Reviews Miss This
There is nothing wrong with reviewing individual trades. It is necessary. Looking at a specific AAPL entry and asking why you got in where you did, what the chart structure looked like, and whether the execution matched the plan is valuable work. Every serious trader should do it.
But individual trade reviews have a ceiling.
The human brain fills in narrative gaps when reviewing. When you look at a single trade, you are constructing a story around it using whatever information and emotional state you have in that moment. You remember feeling cautious. You remember the catalyst. You remember thinking the level was clean. That narrative is not wrong, but it is selective. It filters the experience through how you currently feel and what you currently believe about your trading.
Behavioral analysis in trading removes that filter. It does not ask what you remember. It asks what the data shows across a large enough sample to make the pattern statistically meaningful.
When you look at 200 trades and find that your SPY setups taken on Mondays have a significantly lower execution quality score than the same setups taken Tuesday through Thursday, that is not a narrative. That is a pattern. And patterns are where trading consistency actually comes from, not from trying harder in any given session, but from understanding which conditions and behaviors consistently produce better or worse outcomes for you specifically.
This is also why behavioral analytics compounds. The more sessions you track, the clearer the patterns become. A trader six months into using a behavioral analytics layer has a fundamentally different relationship with their data than a trader reviewing a spreadsheet of the same trades. The trading journal software question is really a behavioral analytics question in disguise: are you building a record, or are you building a feedback system?
What Good Trader Behavior Analytics Looks Like in Practice
The output of behavioral analytics should not be a dashboard that overwhelms you with metrics. It should be a small number of clearly framed insights that actually prompt a change in approach.
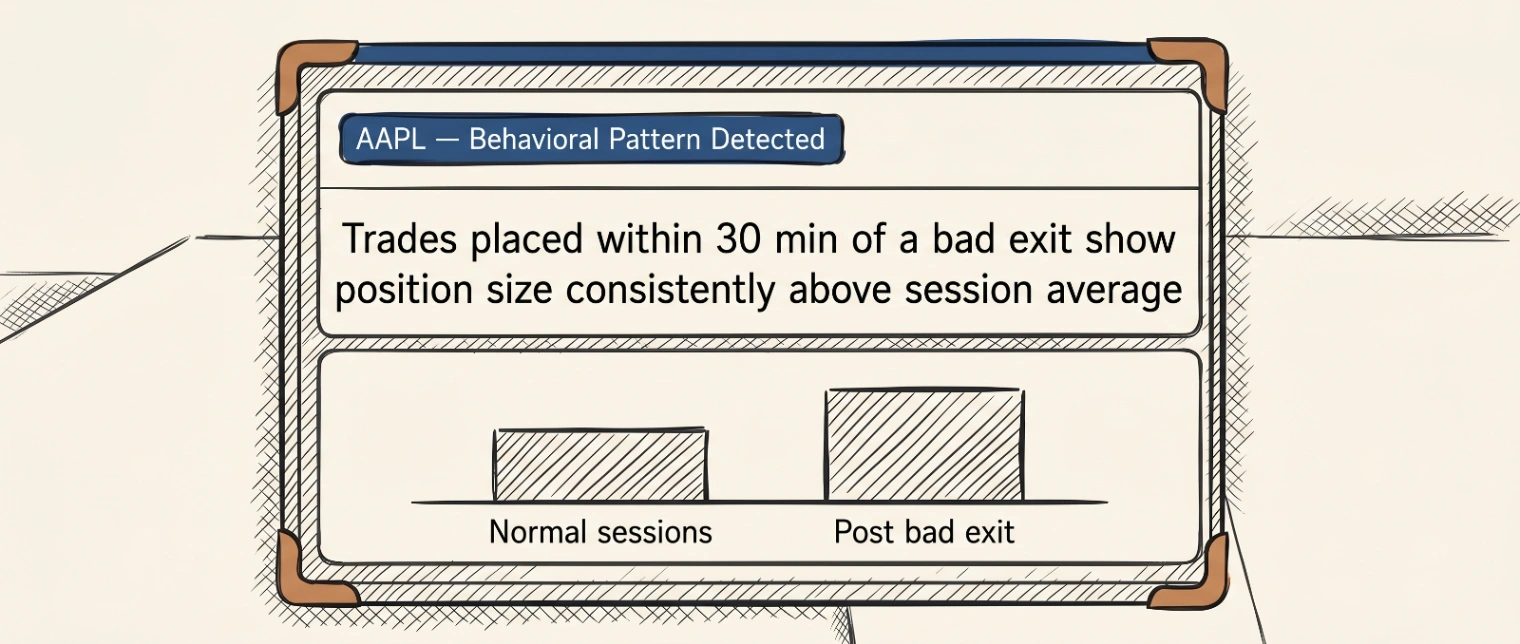
A useful behavioral insight sounds like this: "Your position sizing on trades placed within 30 minutes of a significant adverse move is 40% larger than your session average. This pattern has appeared in 23 of your last 31 sessions." That sentence changes how a trader approaches the next session. It creates awareness of a specific trigger that was previously invisible. It does not tell you what to do. It shows you what you are already doing, so you can decide whether that is what you intended.
This is also why trader behavior analytics is different from trading psychology tools in the general sense. Psychology resources often address mindset at an abstract level, encouraging discipline, emotional control, and plan adherence. Behavioral analytics works at the level of your actual data. It tells you which specific moments in a session trigger specific deviations from the plan, so the insight is concrete rather than aspirational.
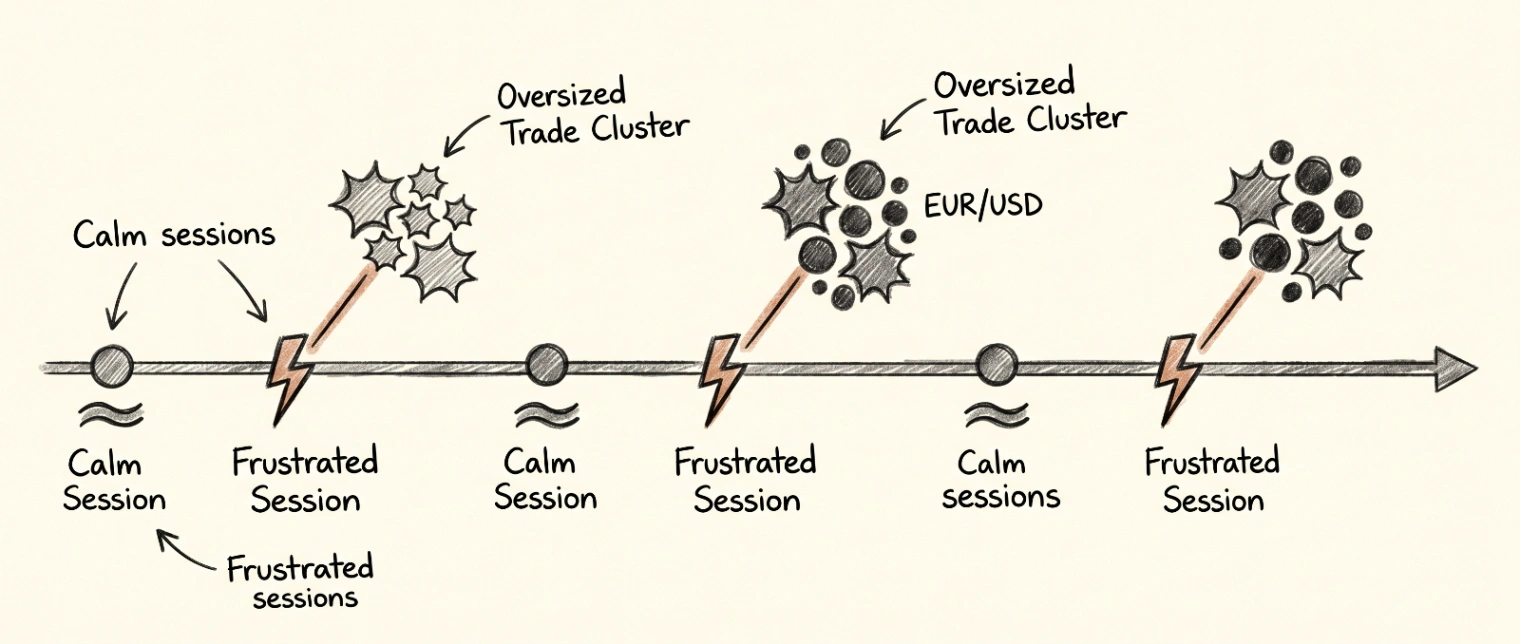
Good behavioral analytics also connects your logged emotional states to your execution data. A session noted as "frustrated after the open" becomes a tag that can be cross-referenced with position sizing decisions made in the same session, producing the kind of emotional trading solutions that work because they are grounded in your specific trade history rather than general advice. The insight is not "manage your emotions better." It is "on sessions logged as frustrated, your average position size is 1.4x your planned size and your exit efficiency drops by 22%."
That specificity is what makes behavioral analytics actionable rather than motivational.
The Connection Between Behavior Analytics and Long-Term Performance
One of the less obvious benefits of trader behavior analytics is its effect on how traders learn over time.
Without behavioral data, the learning process in trading is slow and inconsistent. You make a mistake, you recognize it, you commit to not repeating it, and two months later a similar mistake surfaces in a slightly different context. The lesson did not stick because you never saw it clearly enough for it to become durable knowledge rather than a momentary intention.
With behavioral data, the learning process has traction. You see the pattern across 30 instances rather than one. You see the conditions under which it reliably appears. You see what it costs you across sessions. That specificity makes the knowledge durable in a way that a single trade review rarely achieves.
This is why serious traders who track behavior at the session level tend to improve at a faster rate than traders who track only entries and exits. The feedback loop is tighter and more honest. There is less room for self-deception when the data is showing you the same pattern for the twelfth consecutive time.
For traders using a dedicated day trading journal or any structured logging system, adding behavioral tags from day one is the highest-leverage habit you can build. The tags do not need to be complex. A note on emotional state, a flag for whether the position size matched the plan, and a label for whether the exit was driven by price action or by how you were feeling in the moment. Those three data points, applied consistently, become the foundation of behavioral analysis within a few months.
Starting With Trader Behavior Analytics
You do not need a sophisticated platform to begin. A consistent journal with a few behavioral tags applied to every trade gives you enough material to start identifying patterns within a few weeks.
The tags that matter most are not only setup type or market condition, although those are important. The behavioral tags are: what was your emotional state before this trade? Did this entry follow a bad exit? Did you size this differently than your plan? Did you exit before the target for a reason that had nothing to do with price action?
With those tags applied consistently, even a basic review after 30 to 40 trades will begin to show you things you did not previously know about yourself as a trader. You will see whether your TSLA breakout setups are genuinely performing as expected or whether your memory of your best setups is selective. You will see whether your bad weeks cluster around specific session times or follow certain session sequences. You will see the gap between the trader you intend to be and the trader the data describes.
For traders who want to go further, platforms built specifically for behavioral analysis in trading can automate much of this work. Entry efficiency, exit efficiency, hold time distributions, sizing drift across session sequences, all of these can be calculated from your trade data without manual analysis, provided the data is structured and consistent.
The gap between traders who plateau and traders who keep improving is often not technical knowledge. It is behavioral self-awareness. And that awareness is built rather than found. It comes from looking at your data with the right lens, consistently, over enough time for the patterns to become clear. That is what trader behavior analytics is for.
If you are building a trading journal that does more than record entries and exits, ChartWise is designed for exactly this. Behavioral pattern recognition, session-level analysis, and AI-driven insights are built into the journaling workflow from the start, so the feedback loop starts working from your first session.
Join the waitlist at chartwise.app and be part of the founding cohort.
FAQ
Q1: What is trader behavior analytics?
Trader behavior analytics is the process of analyzing patterns in a trader's decisions and actions across a large number of trades, rather than reviewing each trade in isolation. It looks at things like position sizing changes, hold time patterns, entry timing, and session-level performance to identify habitual behaviors that affect outcomes.
Q2: How is behavioral analytics different from reviewing individual trades?
Individual trade review builds narrative around a single outcome. Behavioral analytics looks at patterns across dozens or hundreds of trades, removing the selective memory and emotional framing that distort single-trade reviews. The patterns it surfaces are statistically meaningful rather than anecdotal.
Q3: What behavioral patterns does trader behavior analytics detect?
Common patterns include reactive position sizing after bad sessions, hold time compression under emotional pressure, setup quality drift following strong performance periods, and session timing biases where certain times of day consistently produce lower execution quality. These patterns are invisible in single-trade reviews but clear in aggregate data.
Q4: Do I need special software for trader behavior analytics?
You can start with a consistent journal and a few behavioral tags applied to every trade. After 30 to 40 tagged trades, patterns begin to emerge in even a basic review. Dedicated platforms automate this process, calculating entry and exit efficiency, sizing drift, and session-level correlations directly from your trade data.
Q5: How long does it take to see meaningful behavioral patterns in trading data?
Most traders start seeing clear patterns after 30 to 50 tagged sessions. The more consistently behavioral data is logged alongside trade data, the faster the patterns become statistically meaningful. Platforms that automate the tagging and correlation process can surface insights faster than manual review.