There’s a moment almost every trader has lived through.
You’re watching the screen. The price starts forming something that looks clean and familiar. Maybe it’s a breakout you’ve traded before. Maybe it’s a structure you’ve studied over and over. You feel that small rush. This looks good, and you enter.
And then… it doesn’t work.
That’s the part that gets to you.
Because it’s not like you didn’t know what you were doing. You’ve studied chart patterns. You can spot a head and shoulders or a double top double bottom without thinking twice. You understand the shapes. You understand the theory.
So why does the outcome still feel inconsistent?
Because seeing trading chart patterns isn’t the same as identifying a high-quality setup.
And once you understand that difference, your entire approach to the market starts to shift.
If you’ve been trading for a while, you already know chart patterns. The problem usually isn’t recognition. It’s quality.
Let’s talk about that.
Knowing Patterns Isn’t the Same as Trading Them Well
Most traders start with technical analysis patterns. It makes sense. Patterns give structure to something that feels chaotic. They create rules. They offer a framework.
You learn the basics:
Head and shoulders for reversals
Double top, double bottom for rejection
Triangle patterns for continuation or breakout
On paper, it’s straightforward.
But once real money is involved, it gets complicated.
You start seeing patterns everywhere. Every pullback looks like a flag. Every pause looks like a triangle. Every minor rejection feels like a reversal.
That’s where chart pattern trading becomes less about shapes and more about judgment
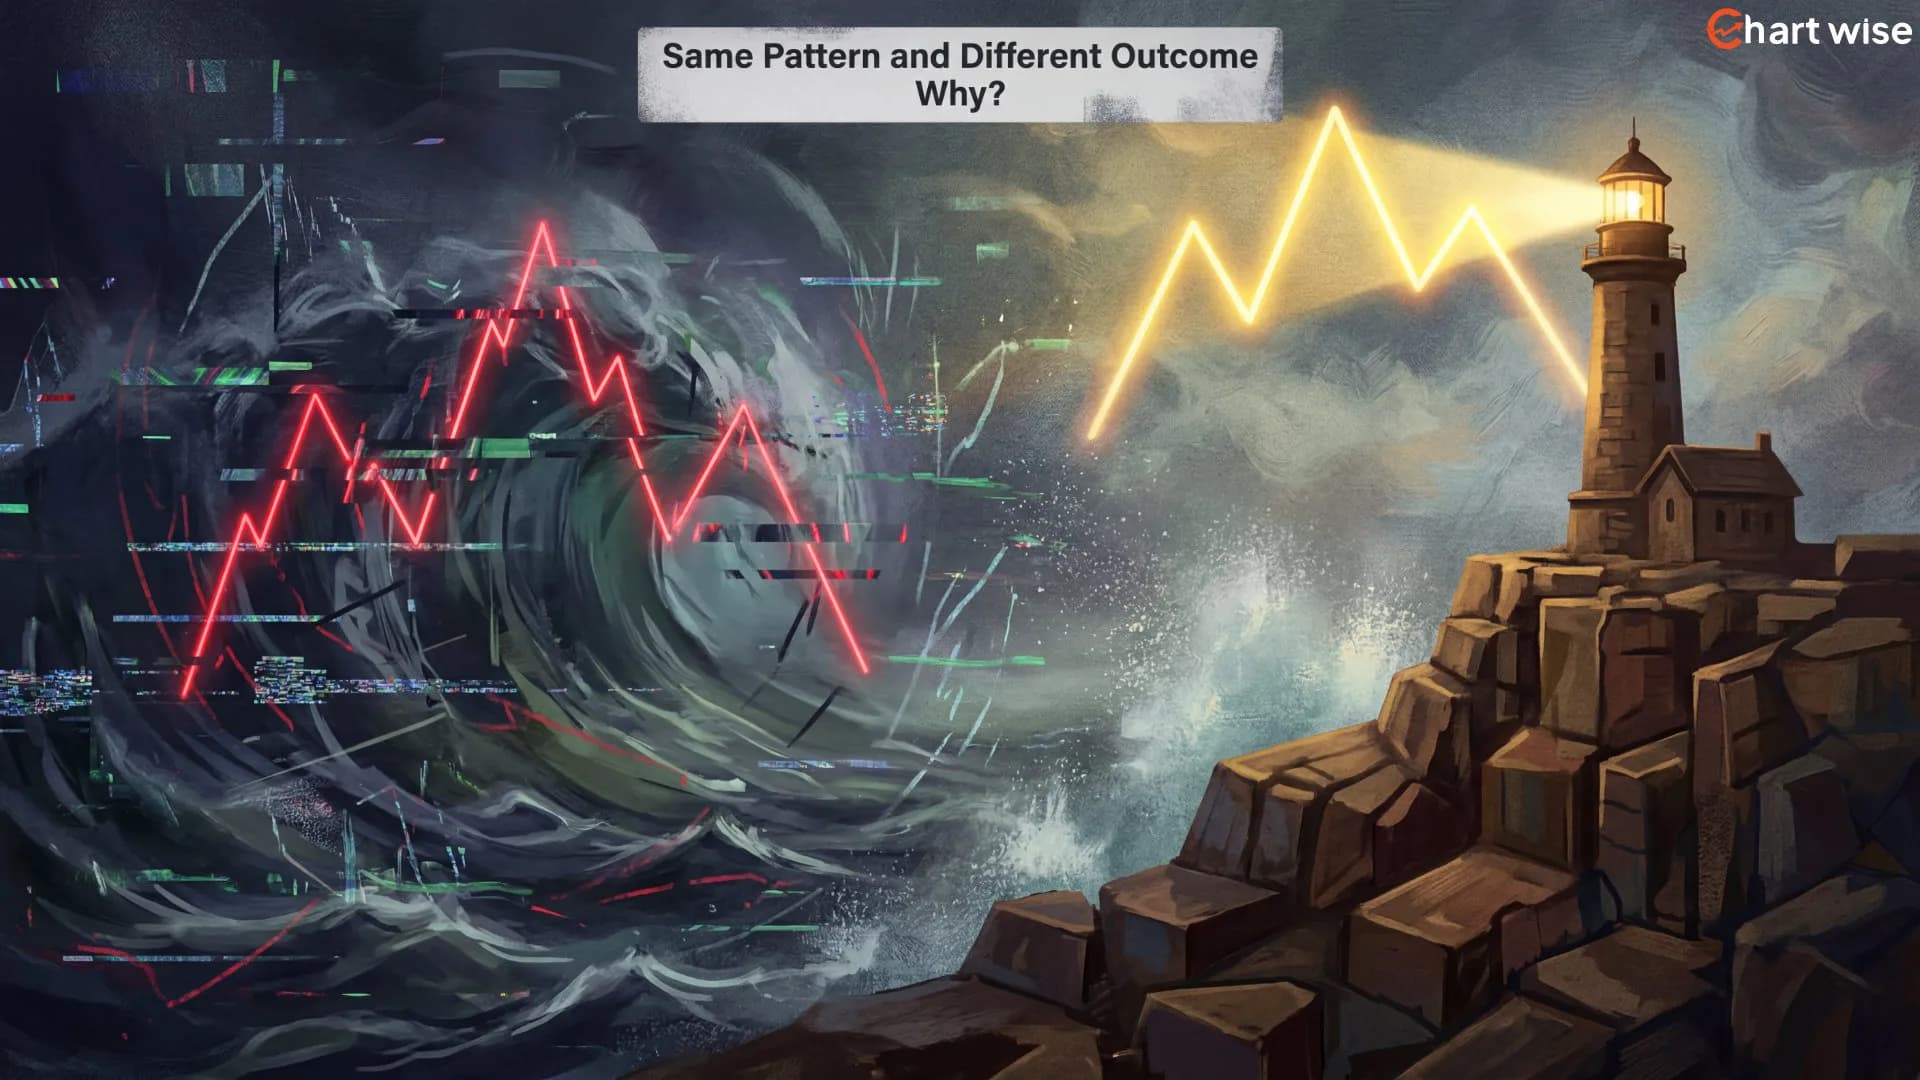
Same Pattern and Different Outcome Why?
This is one of those shifts that doesn’t happen overnight.
Because early on, a pattern feels like the whole answer. You see the structure, you name it, you assume it should work.
But a pattern on its own is just a drawing on the chart. What actually matters is where it’s forming, what came before it, and who’s likely involved at that level. That’s the context and context is what gives a pattern meaning.
Take a head and shoulders, for example.
If it shows up inside a messy, choppy range, it’s often just noise wearing a familiar shape. But if it forms after a strong run-up, right near a major higher time frame level where price has reacted before, it’s a different situation altogether.
Same pattern and different environment.
And this is where a lot of traders get stuck with trading chart patterns. They start treating every head and shoulders, every double top, double bottom, and every triangle pattern like it deserves the same confidence.
But the market doesn’t treat them equally.
The good setups usually have a few subtle signs around them, not loud signals, just quiet clues that the structure actually means something.
High-quality setups usually share a few quiet characteristics :
1. The Location Makes Sense
Where is the pattern forming?
This question alone filters out half the trades most people take.
A double bottom forming at a clear weekly support level tells a different story than one appearing randomly after a small pullback.
Good location adds weight. It shows that larger participants may be involved. It suggests intention.
If you’re trading chart patterns without paying attention to location, you’re missing the bigger picture.
2. The Risk Is Clear
A strong setup gives you a clean invalidation point.
You know where you’re wrong before you enter.
This is where many traders go off track. They focus so much on finding the pattern that they forget to define the risk. Stops become flexible. Targets become emotional.
With high-quality setups, the structure itself defines your boundaries.
A triangle pattern that breaks out with a clear level to lean against? That’s manageable risk.
A messy formation where you’re unsure where to exit if it fails? That’s uncertainty disguised as opportunity.
3. The Reward Justifies the Trade
Even if the pattern is clean, even if the location is solid, if the potential reward doesn’t justify the risk, it’s not worth it.
One of the biggest improvements I’ve seen in traders comes from becoming selective. Not trading more patterns. Trading fewer, better ones.
When you review your past trades, you’ll probably notice something: your best results didn’t come from the busiest days. They came from the clearest setups.
Why Traders Force Patterns
There’s a psychological side to this.
When you’re eager to trade, your brain will find what it wants to see. A minor pullback turns into a “perfect” double top. A small consolidation becomes a triangle.
This isn’t lack of knowledge. It’s impatience.
Over time, traders who last in this business learn to step back. They stop asking, “Is there a pattern here?” and start asking, “Is this worth my risk?”
That small shift changes how you see the market.

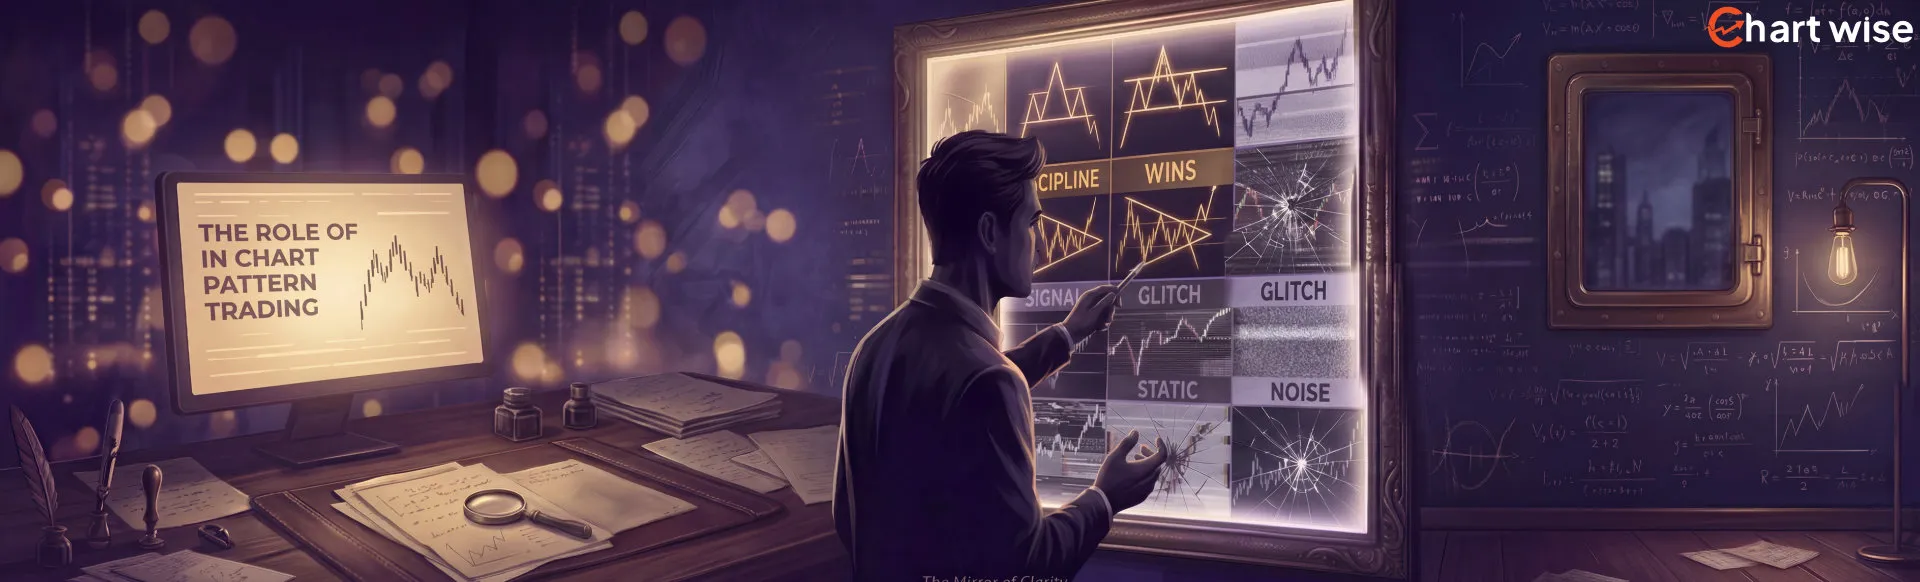
The Role of Review in Chart Pattern Trading
One thing that separates consistent traders from frustrated ones is review.
It’s not about looking back only at the trades that worked out. It’s about going through every single trade you took. The wins, the losses, the clean executions, and the messy ones.
When you track which technical analysis patterns you trade and how they perform over weeks and months, patterns start to emerge in your own behavior.
Maybe your head and shoulders setups work best in trending markets.
Maybe your double-top double-bottom trades fail during high-volatility news weeks.
Maybe triangle patterns give you strong entries, but you tend to exit too early.
Without tracking, it’s all memory. And memory in trading is unreliable.
This is where a structured journal makes a difference. Tools like Chartwise help traders log not just entries and exits, but the type of pattern, the context, and even their emotional state. Over time, you stop relying on feeling and start relying on data.
You begin to see which setups actually align with your strengths.
High-Quality Setups Often Feel Boring
This might sound strange, but the best trades usually don’t feel urgent.
They’re clear. Calm. Obvious in hindsight.
There’s no rush to click. No fear of missing out. Just a simple plan: enter here, risk this, target that.
The more experience traders gain, the more they realize that consistency comes from repetition. Not excitement.
Chart patterns aren’t about predicting the market perfectly. They’re about identifying structured opportunities where risk is defined and probability leans slightly in your favor.
That’s it.
Where Chartwise Fits In
Here’s the part most traders don’t like hearing: you can’t improve what you don’t track.
Because in the moment, every trade feels reasonable. Even the bad ones. Your brain will always find a story for why you entered, why you held, why you moved the stop, why you took profit early. And a week later, you’ll mostly remember the emotional version of the trade, not the factual one.
That’s why review only works when you have clean inputs.
If you’re serious about getting better at chart pattern trading, you need a simple way to capture the full picture while the trade is still fresh:
What pattern was it? (head and shoulders, double top double bottom, triangle patterns)
Where was it forming? (range, trend, higher time frame level)
What was the invalidation?
What was the planned reward?
And honestly, what state of mind were you in?
This is the gap a lot of traders fall into. They’ll take screenshots sometimes, write notes sometimes, and review “when they have time.” But consistency doesn’t come from sometimes.
A tool like Chartwise helps because it removes the friction. You’re not just logging entries and exits. You’re building a repeatable process: pattern type, context, notes, screenshots, and even emotion tags all in one place. So when you review later, you’re not guessing what happened. You’re looking at it clearly.
And when you can see it clearly, you start noticing the stuff that actually matters:
Which trading chart patterns work best for you
Which ones fail in certain market conditions
Which mistakes repeat when you’re tired, rushed, or overconfident
Which “good-looking” setups are actually low-quality in hindsight
That’s when progress stops being random. It becomes a system.
Building Your Own Definition of “Quality”
Every trader eventually develops a personal filter.
You might prefer reversals over continuations. You might trade breakouts more confidently than pullbacks. You might find that certain time frames suit your personality better.
The only way to discover that is through honest tracking and review.
When traders start using a system like Chartwise to document their trading chart patterns consistently, something shifts. They stop chasing every setup and start refining their edge.
They learn what to ignore.
And knowing what to ignore is just as important as knowing what to trade.
The Big Picture
Most traders don’t struggle because they don’t know chart patterns. They struggle because they don’t filter them.
The market will print head and shoulders, double top, double bottom, and triangle patterns every week. The shape is easy to spot. The hard part is knowing when it actually matters.
High-quality setups usually feel simple. They show up in the right place, they give you clear risk, and they don’t require you to “talk yourself into it.” They fit into a process you can repeat.
So the real goal isn’t to learn more technical analysis patterns.
It's better to trade fewer patterns with better context and review your chart pattern trading honestly enough to see what’s working and what’s just familiar.
Do that long enough, and your edge stops being a guess. It becomes your standards.