I've watched a lot of traders open their trade history at the end of the month and just... stare at it. Rows of entries, exits, symbols, dates. All the data is technically there. And yet almost nobody can answer a simple question on the spot: which setup actually works for them.
That's not a data problem. It's an analytics problem. Most trading platforms hand you numbers. Very few help you understand what those numbers mean about how you trade.
The Problem With Just "Having Data"
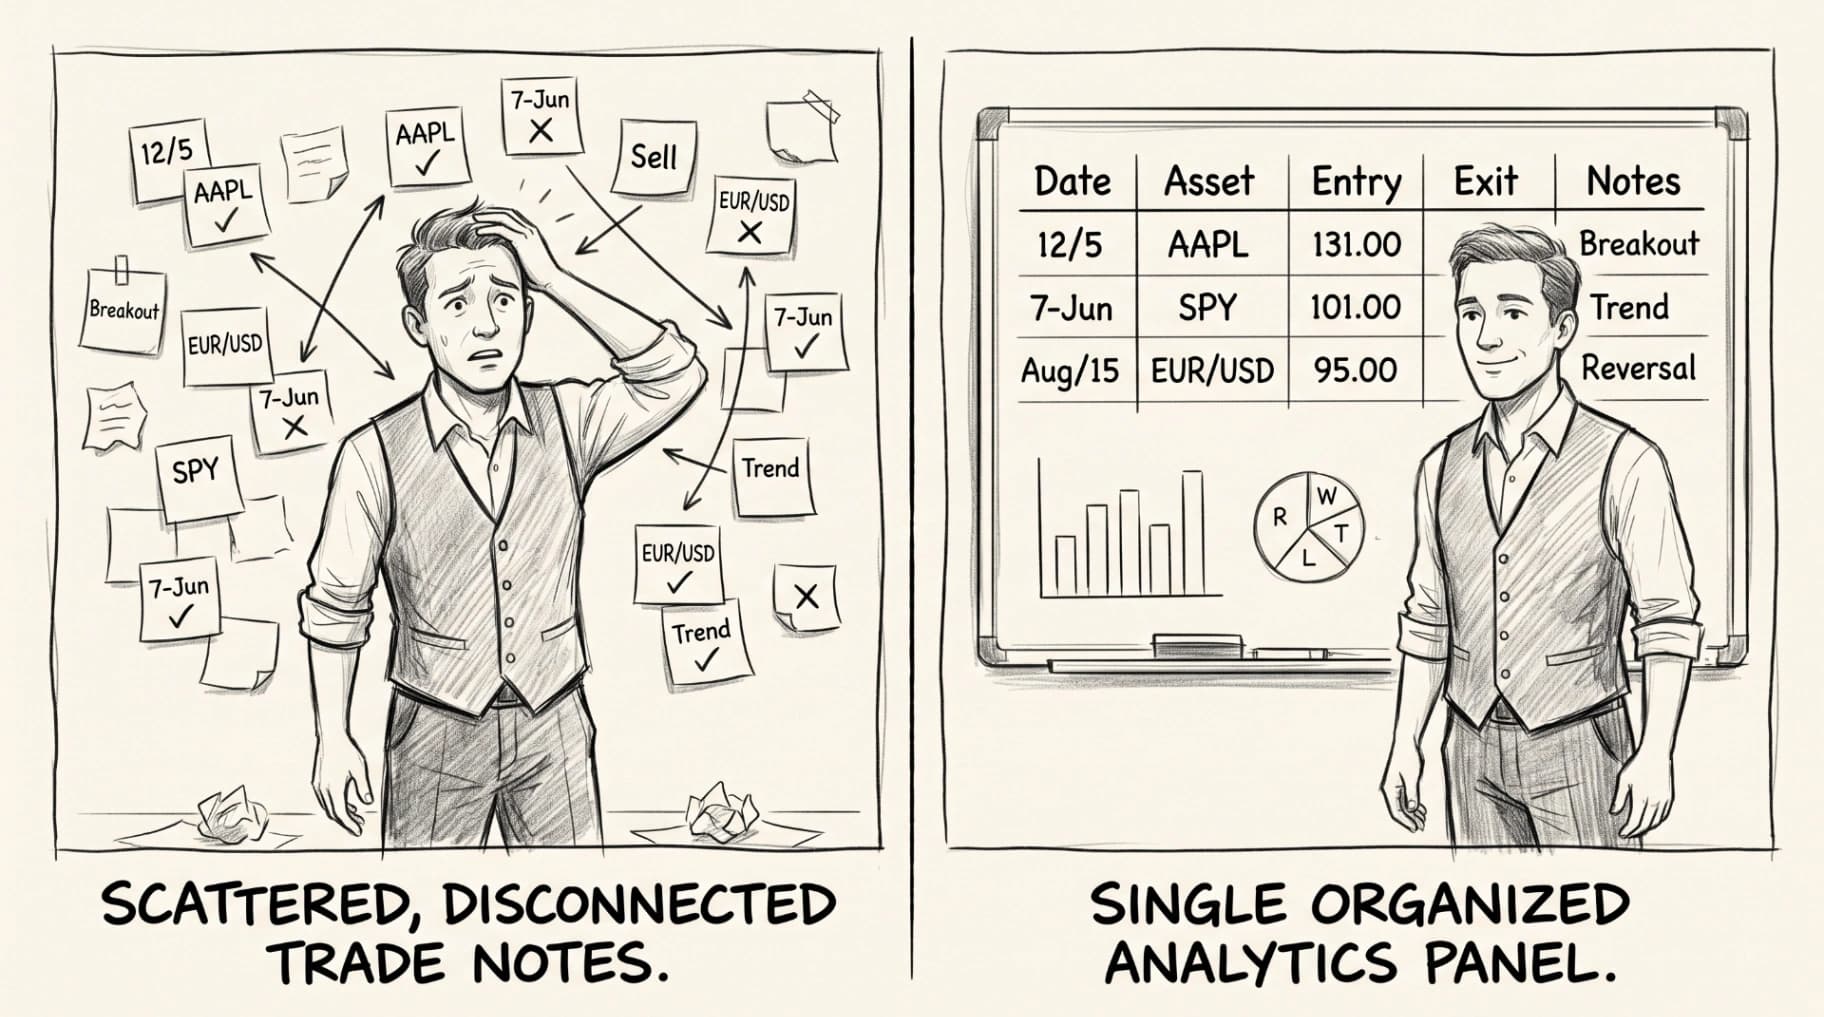
Logging trades feels productive. You write down the symbol, the entry, the exit, maybe a note about why you took it. Over weeks, that log grows into a real archive. But an archive isn't insight. It's just storage.
The gap shows up the moment you try to answer a real question. Not "how many trades did I take this month," but "does my breakout setup actually hold up during high-volatility weeks, or am I just remembering the wins." Raw logs can't answer that. You'd need to manually filter, sort, and cross-reference dozens of entries, and most traders simply don't have the time or patience to do that consistently.
This is where a lot of trading journals quietly fall short. They're excellent at capturing data and much weaker at helping you interpret it.
What Smart Trading Analytics Actually Means
Smart trading analytics isn't a fancier dashboard. It's the layer that sits between your raw trade log and an actual decision. It takes the entries, exits, tags, and notes you've already logged and organizes them into something you can act on: which strategies are consistent, which setups drift under certain conditions, and where your habits quietly work against your plan.
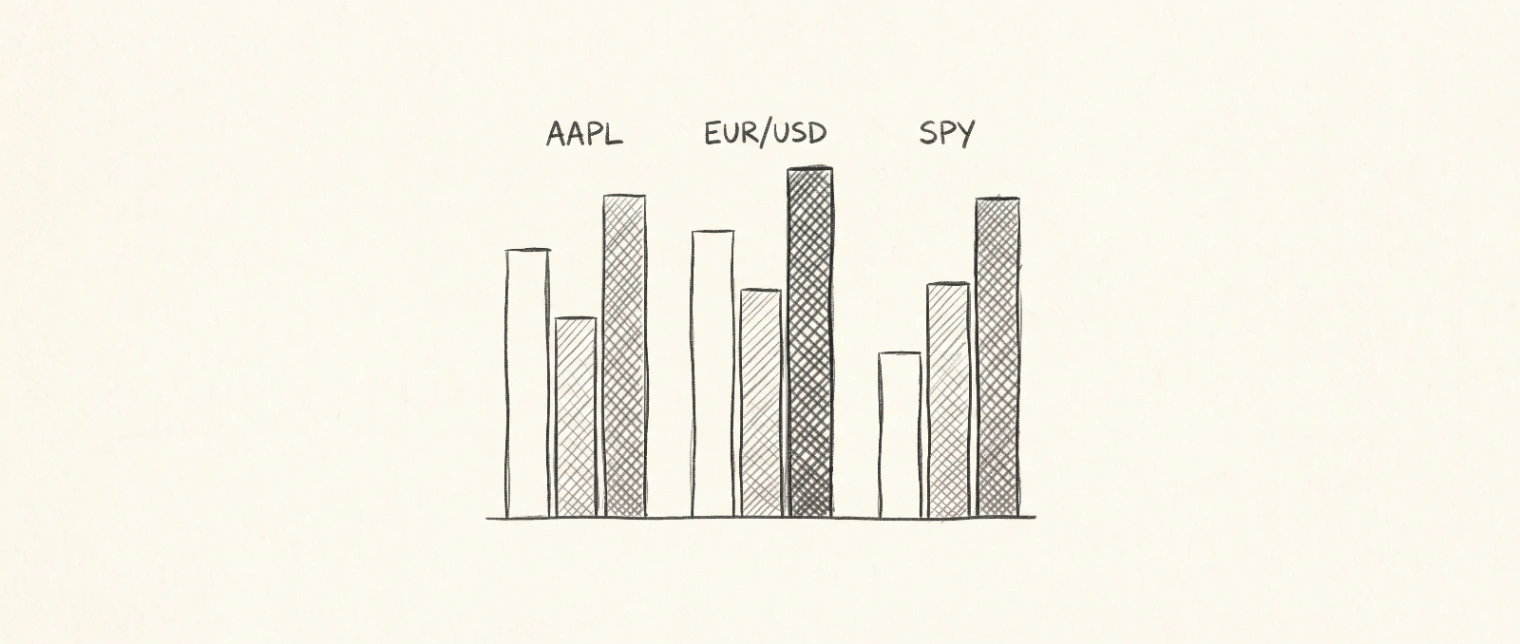
The "smart" part usually comes down to two things. First, automatic segmentation, breaking performance down by strategy, instrument, timeframe, or session without you having to build a spreadsheet pivot table from scratch. Second, pattern surfacing, catching correlations you wouldn't think to look for on your own, like a setup that performs fine most of the time but consistently struggles during a specific market condition.
None of this replaces judgment. It just gives your judgment something solid to stand on instead of memory and gut feeling.
Beyond the Obvious Metrics
Most traders start with the basics: how many trades, how many winners, average outcome. Useful, but shallow. Smart analytics goes a layer deeper into things that actually explain behavior, not just outcomes.
Consistency across setups tells you whether a strategy performs the same way every time you run it, or whether results are scattered enough that "the strategy" is really several different habits wearing one label. Drift over time shows whether a setup that worked well a few months ago is quietly degrading as market conditions shift. Execution quality, how closely your actual entries and exits matched your plan, separates a good strategy from good execution, which are two very different problems with two very different fixes.
Reviewing metrics like these is a habit worth building even before you lean on any tool. For more on what to track and why, our piece on trading performance analysis goes deeper into the specific breakdowns worth setting up.
Turning Numbers Into Behavior
Numbers alone rarely change how someone trades. What changes behavior is seeing the number connected to something specific you did. "Your average holding time on losing trades is triple your winners" is a data point. Realizing that pattern shows up every time you're reluctant to admit a trade isn't working, that's insight.
This is the piece that turns analytics from a report you glance at into something that actually shapes your next trade. It's also where the line between performance data and psychology starts to blur, since the patterns showing up in your numbers are often the same ones driving your decisions in the moment. Our breakdown of behavioral trading analysis covers this connection in more detail if you want to go further into it.
Smart analytics doesn't diagnose you. It just makes the pattern visible enough that you can't keep pretending it isn't there. What you do with that visibility is still entirely up to you.
How ChartWise Approaches Smart Trading Analytics
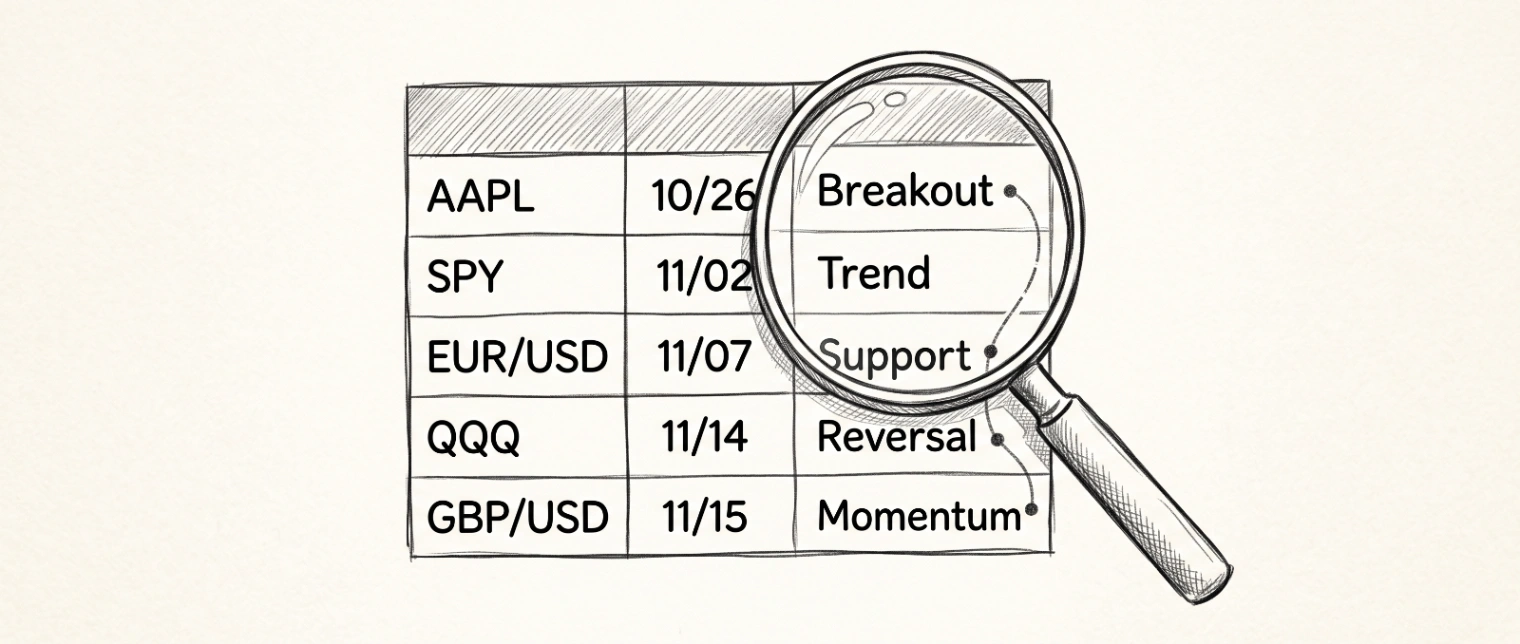
ChartWise was built around the idea that a trading journal's job doesn't end at storage. Every trade you log gets automatically segmented by strategy, instrument, and session, so comparisons that would normally take a spreadsheet and an hour happen instantly. Pattern recognition runs quietly in the background, flagging correlations between conditions and outcomes that are easy to miss when you're reviewing trades one at a time.
The goal isn't to hand you a verdict. It's to hand you a clearer picture, so the conclusions you draw are based on what's actually in your data instead of what you remember most vividly. If you're curious how the AI layer behind this works more broadly, our overview of AI trading software walks through the mechanics, and our piece on predictive trading software covers how historical patterns get used to inform what might come next.
Building the Habit of Reviewing, Not Just Recording
None of this matters if analytics becomes another thing you check once and forget. The traders who actually benefit from smart analytics treat review as a routine, not an event. A short weekly check-in, ten minutes with your strategy breakdown, is enough to catch drift before it becomes a real problem, and enough to confirm when something is working so you can lean into it with more confidence instead of hesitation.
Data only becomes insight when someone actually looks at it on a regular basis. The best analytics engine in the world can't fix a journal nobody reviews. But paired with a consistent habit, it turns a pile of trade history into something genuinely useful: a clear, honest picture of how you actually trade, not how you remember trading. And once that picture starts influencing which biases quietly shape your decisions, it's worth reading through our guide on cognitive trading biases to see how the two connect.
FAQ
What makes trading analytics "smart" instead of just a dashboard?
A standard dashboard displays numbers. Smart analytics organizes and segments those numbers automatically, surfacing patterns and correlations across strategies, instruments, and conditions without requiring manual filtering or spreadsheet work.
Do I need a large trade history for analytics to be useful?
Patterns become more reliable with more data, but even a few weeks of consistently logged trades can reveal early trends worth watching, especially around execution habits and setup consistency.
How is this different from just tracking win rate?
Win rate is a single, surface-level number. Smart analytics looks at consistency, drift over time, and execution quality, factors that explain why the win rate looks the way it does, not just what it currently is.
Can analytics alone improve my trading?
Analytics surfaces the pattern. Acting on it is still on the trader. The value comes from pairing clear data with a consistent review habit, not from the numbers alone.